Get new posts by email or rss feed
For my studies to determine interventions to reduce my blood pressure, the main measurement device I’ll be using will be an Omron Evolve blood pressure monitor. In order to understand the measurements I make, I’m going to need to know the repeatability and reproducibility of the device as well as any systematic biases in the measurements. Notably, some people see blood pressure readings drop with repeat measurements (see comment from Gary Wolf here) and I need to know the magnitude of the effect for any paired sample testing over short time periods.
To measure the repeatability and reproducibility of my Omron Evolve blood pressure meters, I tested (details in below):
- Repeatability: 19 sets of 5 measurements on the same meter
- Reproducibility: 56 paired measurements on two different meters (one immediately following the other)
Here’s what I found.
Summary
- Experiments:
- Repeatability: 19 sets of 5 measurements on the same meter
- Reproducibility: 56 paired measurements on two different meters (one immediately following the other)
- Results:
- Within meter standard deviation was ~3 mmHg, which is high compared to my target reduction of 10 mmHg.
- I see a drop in blood pressure with repeat readings, but it’s relatively small (~0.5-1 mmHg/measurement over 5 measurements), and safe to ignore.
- There’s no detectable difference between my two meters. Since the older one has been used for ~4 months, that indicates that there’s likely no change in the meter over time.
- Conclusions:
- Given the high variance vs. my target change in blood pressure, going forward I will take sets of 5 measurements for every observation.
- This gives an estimated 95% CI of 2.6 mmHg systolic. Still higher than I’d like, but it should allow me to identify reasonable effect sizes (I’ll, of course, need to do power calculations for each planned experiment).


Details
Purpose
- To determine the repeatability & reproducibility of blood pressure measurements using my Omron Evolve blood pressure meters.
- To quantify the drop in blood pressure with repeat measurements at the same sitting.
Background
Results & Discussion
Within-meter Repeatability
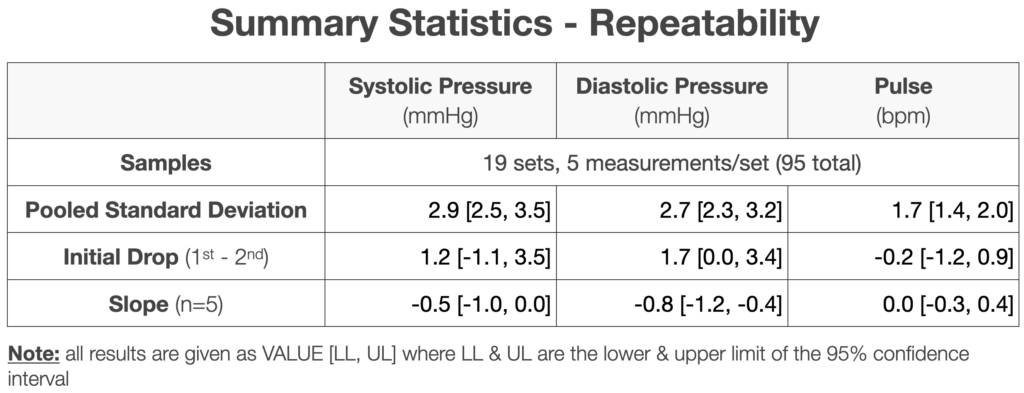
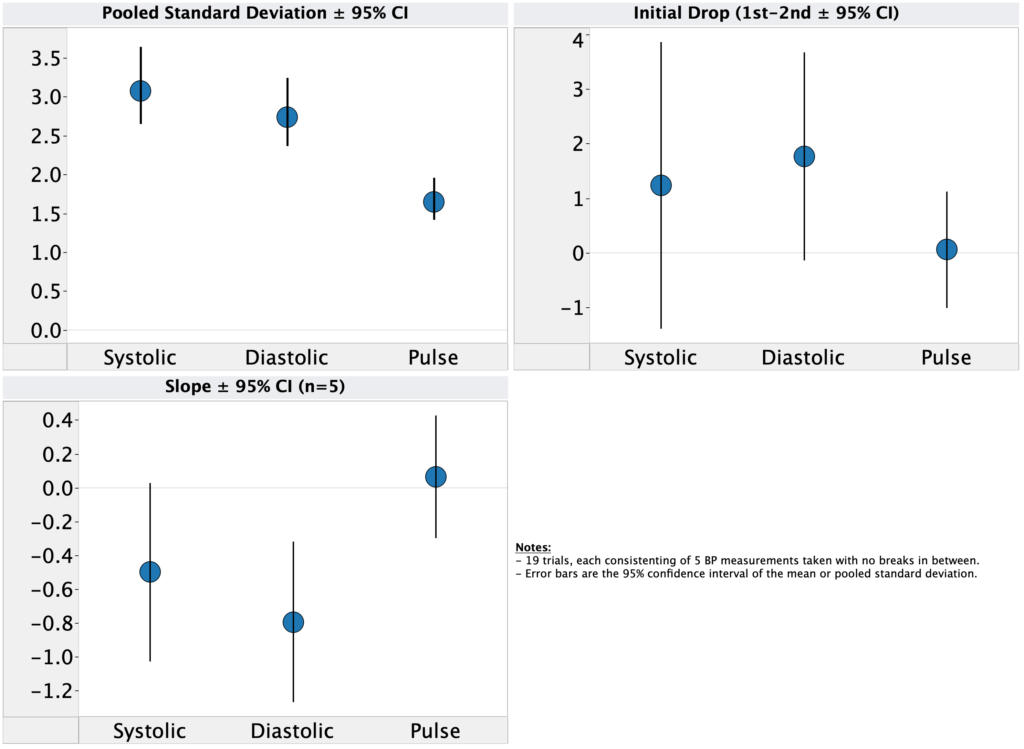
First, let’s take a look at the within meter precision. The pooled standard deviation over 19 sets of 5 measurements was 2.5-3.5 mmHg (95% CI) for systolic and a bit lower for diastolic. This means that for a single-point measurement, I’d have a 95% confidence interval of ~6 mmHg, larger than most effect sizes seen for BP interventions and half the reduction I need to get to normal blood pressure.
To quantify the drop in blood pressure with repeat measurement, I looked at both the initial drop (1st – 2nd measurement) and the slope over all 5 measurements. I observed a drop for systolic and diastolic pressure in both cases. Only the diastolic slope was statistically significant (95% CI does not overlap 0), but given that I see an effect for all four metrics and of consistent magnitude, the drop is likely real. That said, the drop is only ~0.5-1 mmHg/measurement, small enough to safely ignore for most experiments I plan to do.
Between-meter Reproducibility
Next, let’s look at the variation between meters. For this experiment, I used an older meter that I’ve been using daily for ~4 months and compared it to a newer meter of the same make/model that I bought when I mistakenly thought I had lost the original.
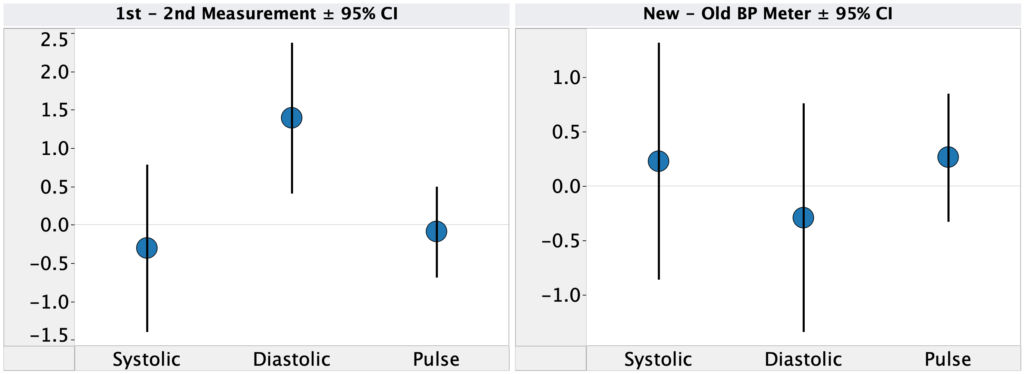
For the 56 paired reproducibility measurements, I alternated which meter I used first, giving me another data set to test for a drop in reading with repeat measurements. In this case, I saw a drop with diastolic pressure, 1.4 mmHg [0.4, 2.4 95% CI], but not systolic pressure, -0.3 [-1.4, 0.8 95% CI]. However, the confidence intervals are consistent with the previous measurements, again indicating the effect is likely real.
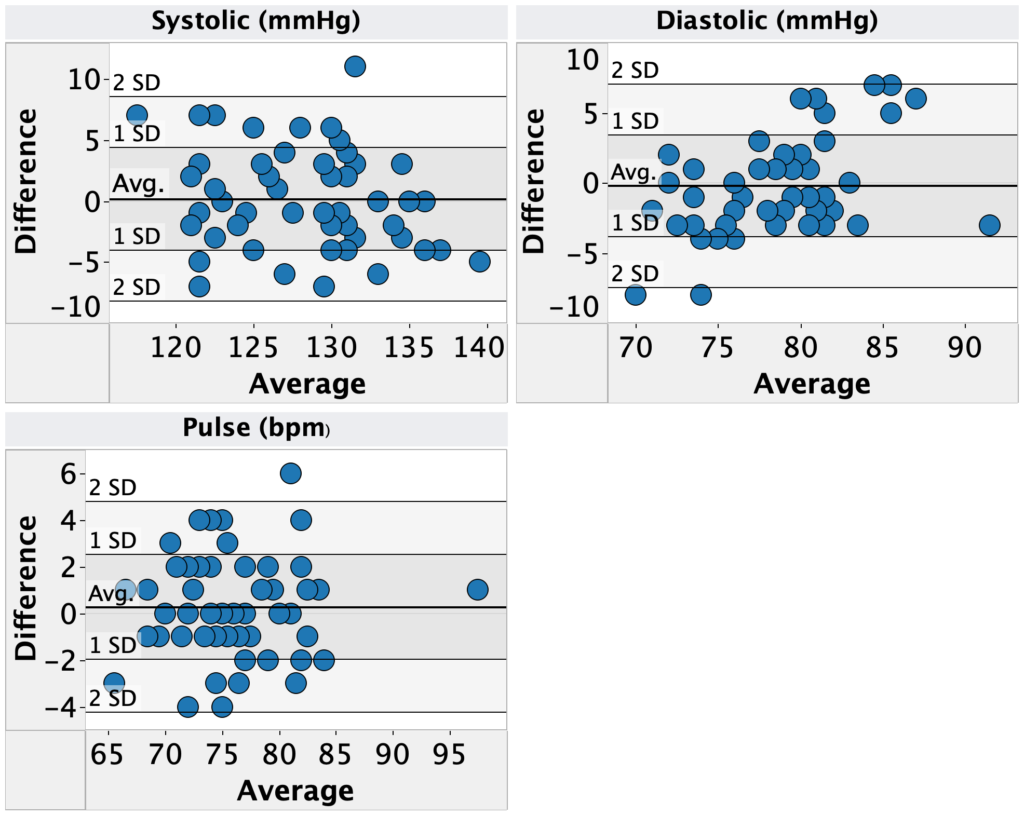
Comparing the two meters, there’s no measurable difference. Average difference is <0.3 mmHg with 95% confidence intervals comfortably overlapping zero. Since the older one has been used for ~4 months, that also indicates that there’s likely no change in the meter over time.
Conclusions & Next Experiments
Given the high observed variance, going forward I will start measuring sets of 5 repeat measurements for each observation. This gives an estimated 95% CI of 2.6 mmHg systolic. Still higher than I’d like, but it should allow me to identify reasonable effect sizes (I’ll, of course, need to do power calculations for each planned experiment).
Unfortunately, I’ve already finished my initial testing of deep breathing protocols using only single-point measurements. I’ll go ahead and analyze that data, but if the results are inconclusive, I will repeat the experiment with this new protocol.
– QD
Methods
Pre-registration
This experiment was not pre-registered.
Blinding
This experiment was not blinded
Procedure
- General:
- Blood pressure measurements we performed using an Omron Evolve blood pressure meter.
- For each measurement, I placed the meter on my left arm, ~4 cm above my elbow. Measurements were taken seated, with my feet on the ground and arms resting on a flat surface at a comfortable height (same every time).
- Repeatability
- For 8 days, whenever I measured my blood pressure, I would repeat the measurement 5 times, with no breaks in between measurements.
- Reproducibility
- For 14 days, whenever I measured my blood pressure, I would repeat the measurement twice, once with each of two meters.
Data Visualization
Data was visualized using Tableau.
Hello – have not seen any updates from you since Dec 2021. Just checking if all is well. I enjoy getting your email updates.
Best regards,
T
Thanks for checking in. I started a new job in January and had trouble finding time for the blog (2nd time that’s happened; very frustrating…). I’m trying to get back into it and will hopefully be posting some new content soon.