Get new posts by email or rss feed
This self-experiment is being done as part of the Keating Memorial Self-Research Project. A couple of other people from the Open Humans community are also running the same experiments. If you’re interested in joining in, let me know in the comments or send me a PM.
This post is an update on my experiments measuring the effect of food ingredients on blood sugar.
Plan:
- Design experiments and solicit feedback: blog, Reddit, OpenHumans
- Calibrate continuous blood glucose meter: started 2/18, report tbd. (probably 3/16)
- Establish fasting baseline & determine time of day for experiments: Complete
- Food effect measurements
- Dissolved glucose: Complete (this post)
- Allulose: starting 3/9
The analysis & calibration of the data from my CGM is more complicated than I expected, though extremely interesting. It’s going to take me another week or two to get it written up. In the meantime, I have the results from the first ingredient, dissolved glucose.
Summary
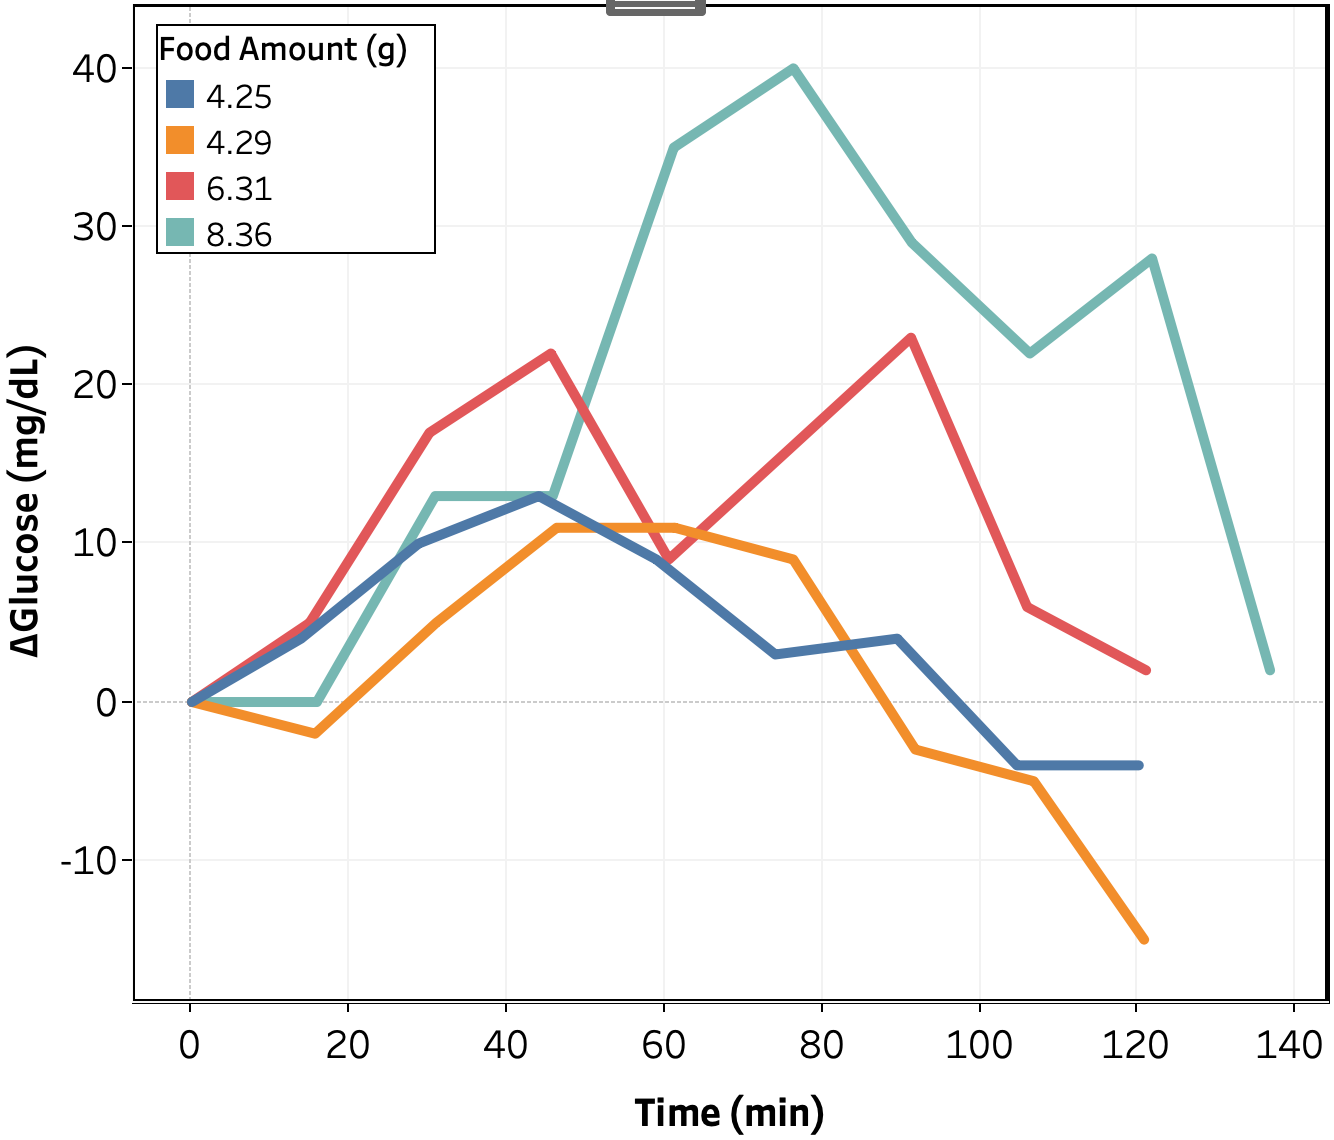
- Dissolved glucose raises my blood sugar by 6.7 mg/dL/gglucose, with the peak occurring from 45-75 min. after ingestion.
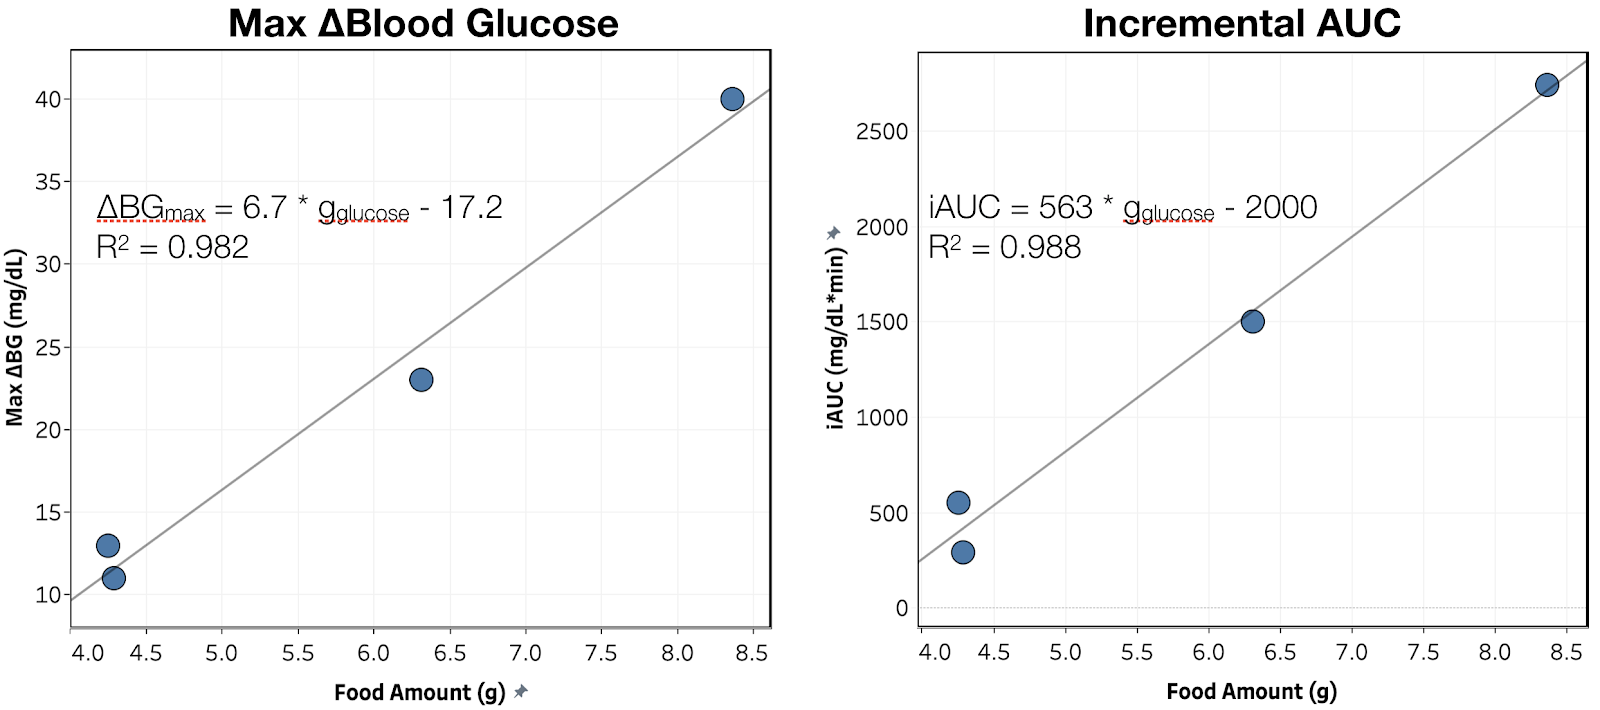
- Results are extremely linear with amount consumed, with a slightly better fit when using incremental area under the curve (iAUC) vs. the peak increase (R2 = 0.988 vs. 0.983).
Details
Purpose
To quantify the effect of ingestion of dissolved glucose on my blood sugar.
Design/Methods
Procedure. From 7 pm the day before through 4:30p the day of experiment, no food or calorie-containing drinks were consumed and no exercise was performed. Non-calorie-containing drinks were consumed as desired (water, caffeine-free tea, and decaffeinated coffee). At ~12 pm, glucose was dissolved in 475 mL of water and ingested as rapidly as comfortable. BGM measurements were then taken approximately every 15 min. for 2 h or until blood glucose had returned to baseline, whichever was longer.
Measurements. Blood glucose was measured using a FreeStyle Libre flash glucose monitor and a FreeStyle Freedom Lite glucose meter with FreeStyle lancets & test strips. No special precautions were taken to clean the lancing site before measurement. To take a sample, the lancing devices was used to pierce the skin at an ~45 deg. angle from the finger. Blood was then squeezed out by running the thumb and pointer finger of the opposite hand from the first knuckle to the lancing site of the finger. Blood was then wicked into a test strip that had been inserted into the meter and the glucose reading was recorded.
Data Processing & Visualization. iAUC was calculated using the trapezoid method (see data spreadsheet for details). Data was visualized using Tableau.
Medication. I took my normal morning and evening medication, but did not dose for the glucose.
Data
Results & Discussion

Change in blood glucose as a function of time is shown in Figure 1. Qualitatively, upon ingestion I observe an increase in blood glucose, with the magnitude and time to peak increasing with increasing amount of glucose. In all cases, my blood glucose returned to baseline within 135 min.

To better quantify the impact of glucose on my blood glucose, I plotted the maximum increase in blood glucose and the iAUC of blood glucose (incremental area under the curve) vs. glucose consumed. As shown in Figure 2, both measures were extremely linear vs. amount consumed, with a slightly better fit when using incremental area under the curve (iAUC) (R2 = 0.988 vs. 0.983). However, in both cases there was a large negative intercept, suggesting either a background drop in blood sugar or a non-linear effect that would show up with a wider range of amounts.
Conclusion & Next Experiments
Based on the both the repeatability and linearity of the data, my experimental protocol appears to be working well. This week, I will try the first of the low-carb ingredients, Allulose.
– QD