Low-Carb Bread: Blood Glucose Testing of 16 Varieties with a few Promising Results

Get new posts by email or rss feed
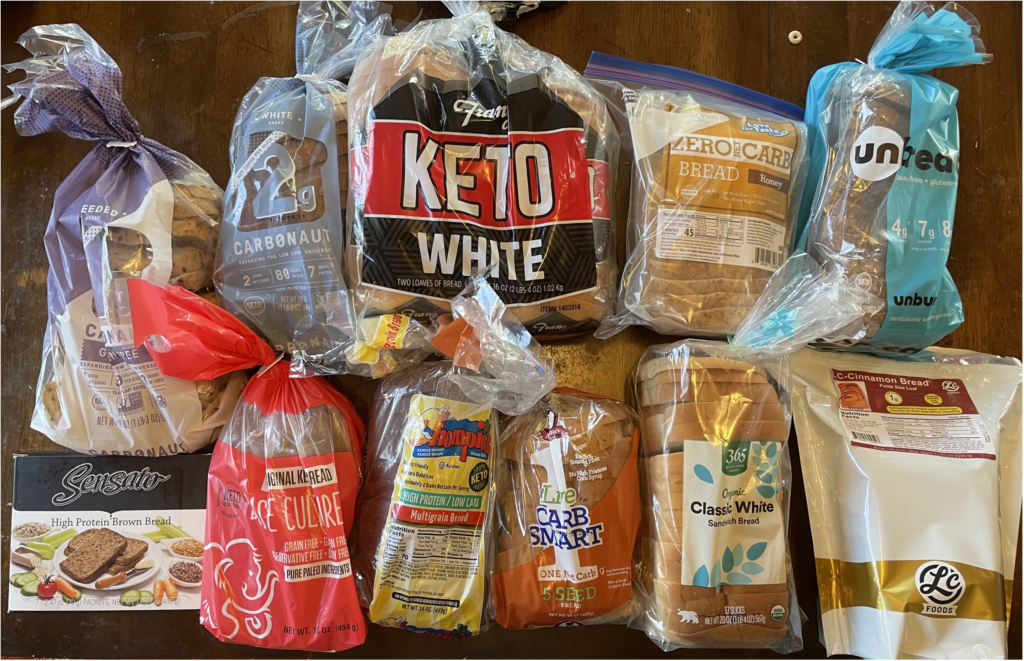

Photo collage of breads tested

This post is an update on my experiments measuring the effect of low-carb foods and dietary supplements on blood sugar.

This week, I have the results from low-carb breads. Next week I’ll be posting results from commenter requests, followed by chocolate.


Testing Queue:

  • Prepared foods:
    • Snack bars: in queue
    • Chocolate: in queue
  • Ingredients:
    • Flour replacements: in queue
    • Seeds & nuts: in queue
    • Vegetables: in queue
  • Supplements:

Bread

Summary

One of the most difficult foods to make low carb is bread. Flour imparts multiple functions to the final product: taste, texture, water absorption, cohesion (via gluten), browning, food for yeast, etc. There are numerous good substitutes for one or the other of these properties, but to get them all, you’d need a complex combination of ingredients.

Recently, there’s been an explosion of commercially available low carb products both on-line and at supermarkets, including a number of low carb breads. Although the net carb counts look good for most of these, I’ve become very suspicious of the blood sugar impact of some of the dietary fibers used (see evidence of blood glucose impact of dietary fibers here & here). 

To see if any of these low-carb breads would hold up, I tested them myself. I tested 14 breads from 4 different categories (resistant starch, protein & flour or fiber, and egg & nut), plus regular white bread as a control.

This was the most interesting of my prepared food studies so far. There was a huge variation in taste, texture, and BG impact and some mysteries that I’ll need to unravel (what’s going on with the resistant starches?).

Here’s my overall conclusions:

  • Lowest BG impact: UnBun UnBread
    • <10% BG impact of regular white bread; <50% of the next best
  • Best combination of taste & impact: Carb0naut White & Kiss My Keto Golden Wheat
    • ~25% BG impact of regular white bread
    • Very different taste & texture, but both really good
  • There’s a large range in impact from different resistant starches.
    • No idea what’s going on here, but I’m very curious. Maybe I should source/test different resistant starches and see how their BG impact varies.
    • Does anyone have any hypotheses? If so, please let me know in the comments.
  • BG impact is not easy to predict from the primary ingredients or nutrition label due to not knowing the ingredient ratios. Breads with actual flour can have the same impact as ones with indigestible fibers and two breads with the same total and/or net carb count can have wildly different impact.
    • The only way for me to know the impact of a food is to do a controlled test.
    • For someone without diabetes, this would probably require eating a large amount, as you’d need to induce an BG rise (since an insulin spike wouldn’t be measurable).

Does anyone know any other good low-carb breads or other low-carb foods I should try?

As always, please let me know if you have any thoughts, suggestions, or anything else you’d like to see me test.


– QD

Details

Continue reading “Low-Carb Bread: Blood Glucose Testing of 16 Varieties with a few Promising Results”

Weekly Update & Health Statistics: 9/5/21

I’m always looking for collaborators for future experiments. If you’re interested in collaborating on scientifically rigorous self-experiments with low-carb foods, supplements, or other health interventions, please let me know in the comments or via the contact form on the right.


I was hoping to post the results from my bread testing yesterday, but due to a bunch of shipping delays, the last 3 breads didn’t come in time (last one arrives Tuesday). I want to report out a thorough data set, so I’m delaying the report until next weekend.

Experiments this week focused on the last few low-carb breads and some reader requests from the last few posts, including adding “control” foods for each category (regular, non-low carb versions). I’ve posted “requests for request” to this blog and various subreddits and will test them over the next couple weeks and report back.


Active & Planned Experiments

  • Comprehensive Bloodwork
    • Goal: Establish baseline for a broad range of biomarkers and check overall health
    • Approach: WellnessFX Premium panel
    • Status: Complete, need to write up.
  • Blood Glucose Impact of Low-Carb Foods
    • Goal: Determine blood glucose impact of low-carb foods, supplements, and ingredients
  • Methods of Sleeping Longer

Let me know in the comments if there’s any other experiments you’d like to see.


– QD


Observations & Data

Continue reading “Weekly Update & Health Statistics: 9/5/21”

Weekly Health Statistics: 7/11 – 7/17/21

Get new posts by email or rss feed


For those checking the dates, I post these with a 1-week lag. 

Summary:

What I’m tracking

  • Sleep: 
    • Metrics: total time, heart rate variability, pulse (sleeping vs. waking)
    • Method: Apple watch + Autosleep app
    • Frequency: daily
  • Blood glucose:
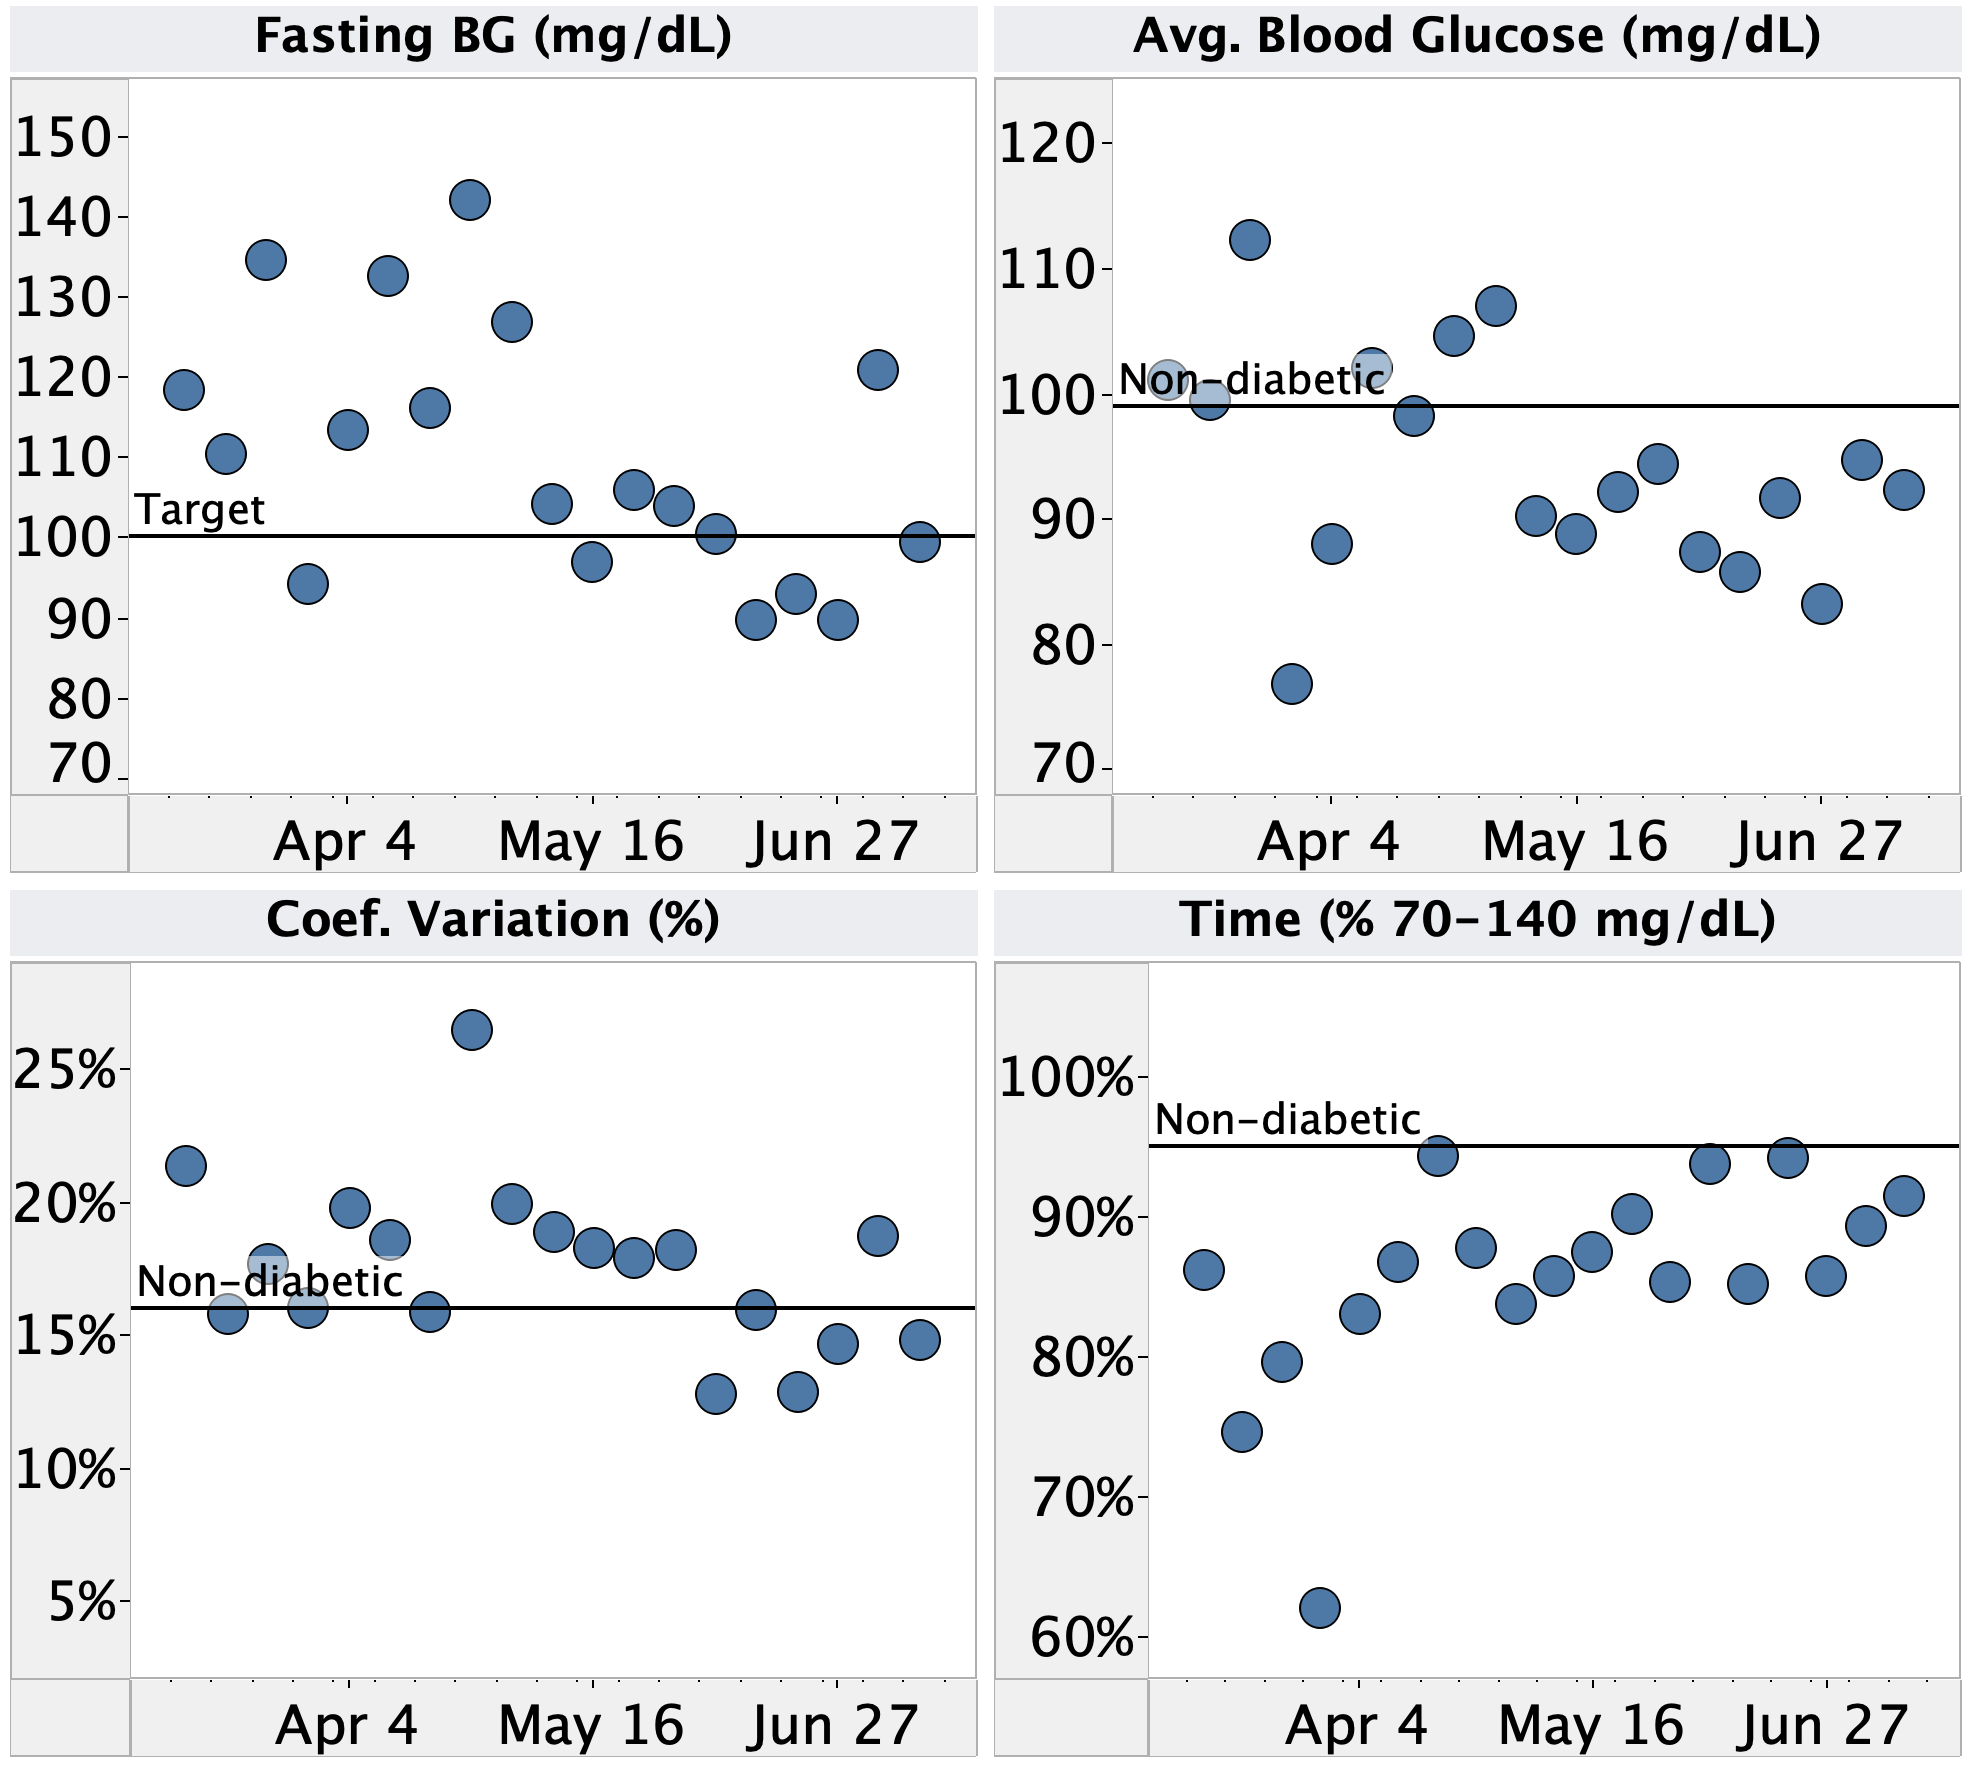
    • Metrics: fasting BG, Avg. BG, coefficient of variation, time 70-140 mg/dL, time <60 mg/dL
    • Method: Dexcom G6 CGM
    • Frequency: continuous
  • Body:
    • Metrics: weight, waist circumference, BMI, waist/height
    • Method: scale + Renpho tape measure
    • Frequency: weekly
  • Other blood:
    • Metrics: hemoglobin, cholesterol, blood pressure, pulse
    • Method: Hemocue 801Cardiocheck PAOmron 10
    • Frequency: weekly for blood pressure & pulse, every 2 weeks for hemoglobin & cholesterol

Observations

  • Sleep:
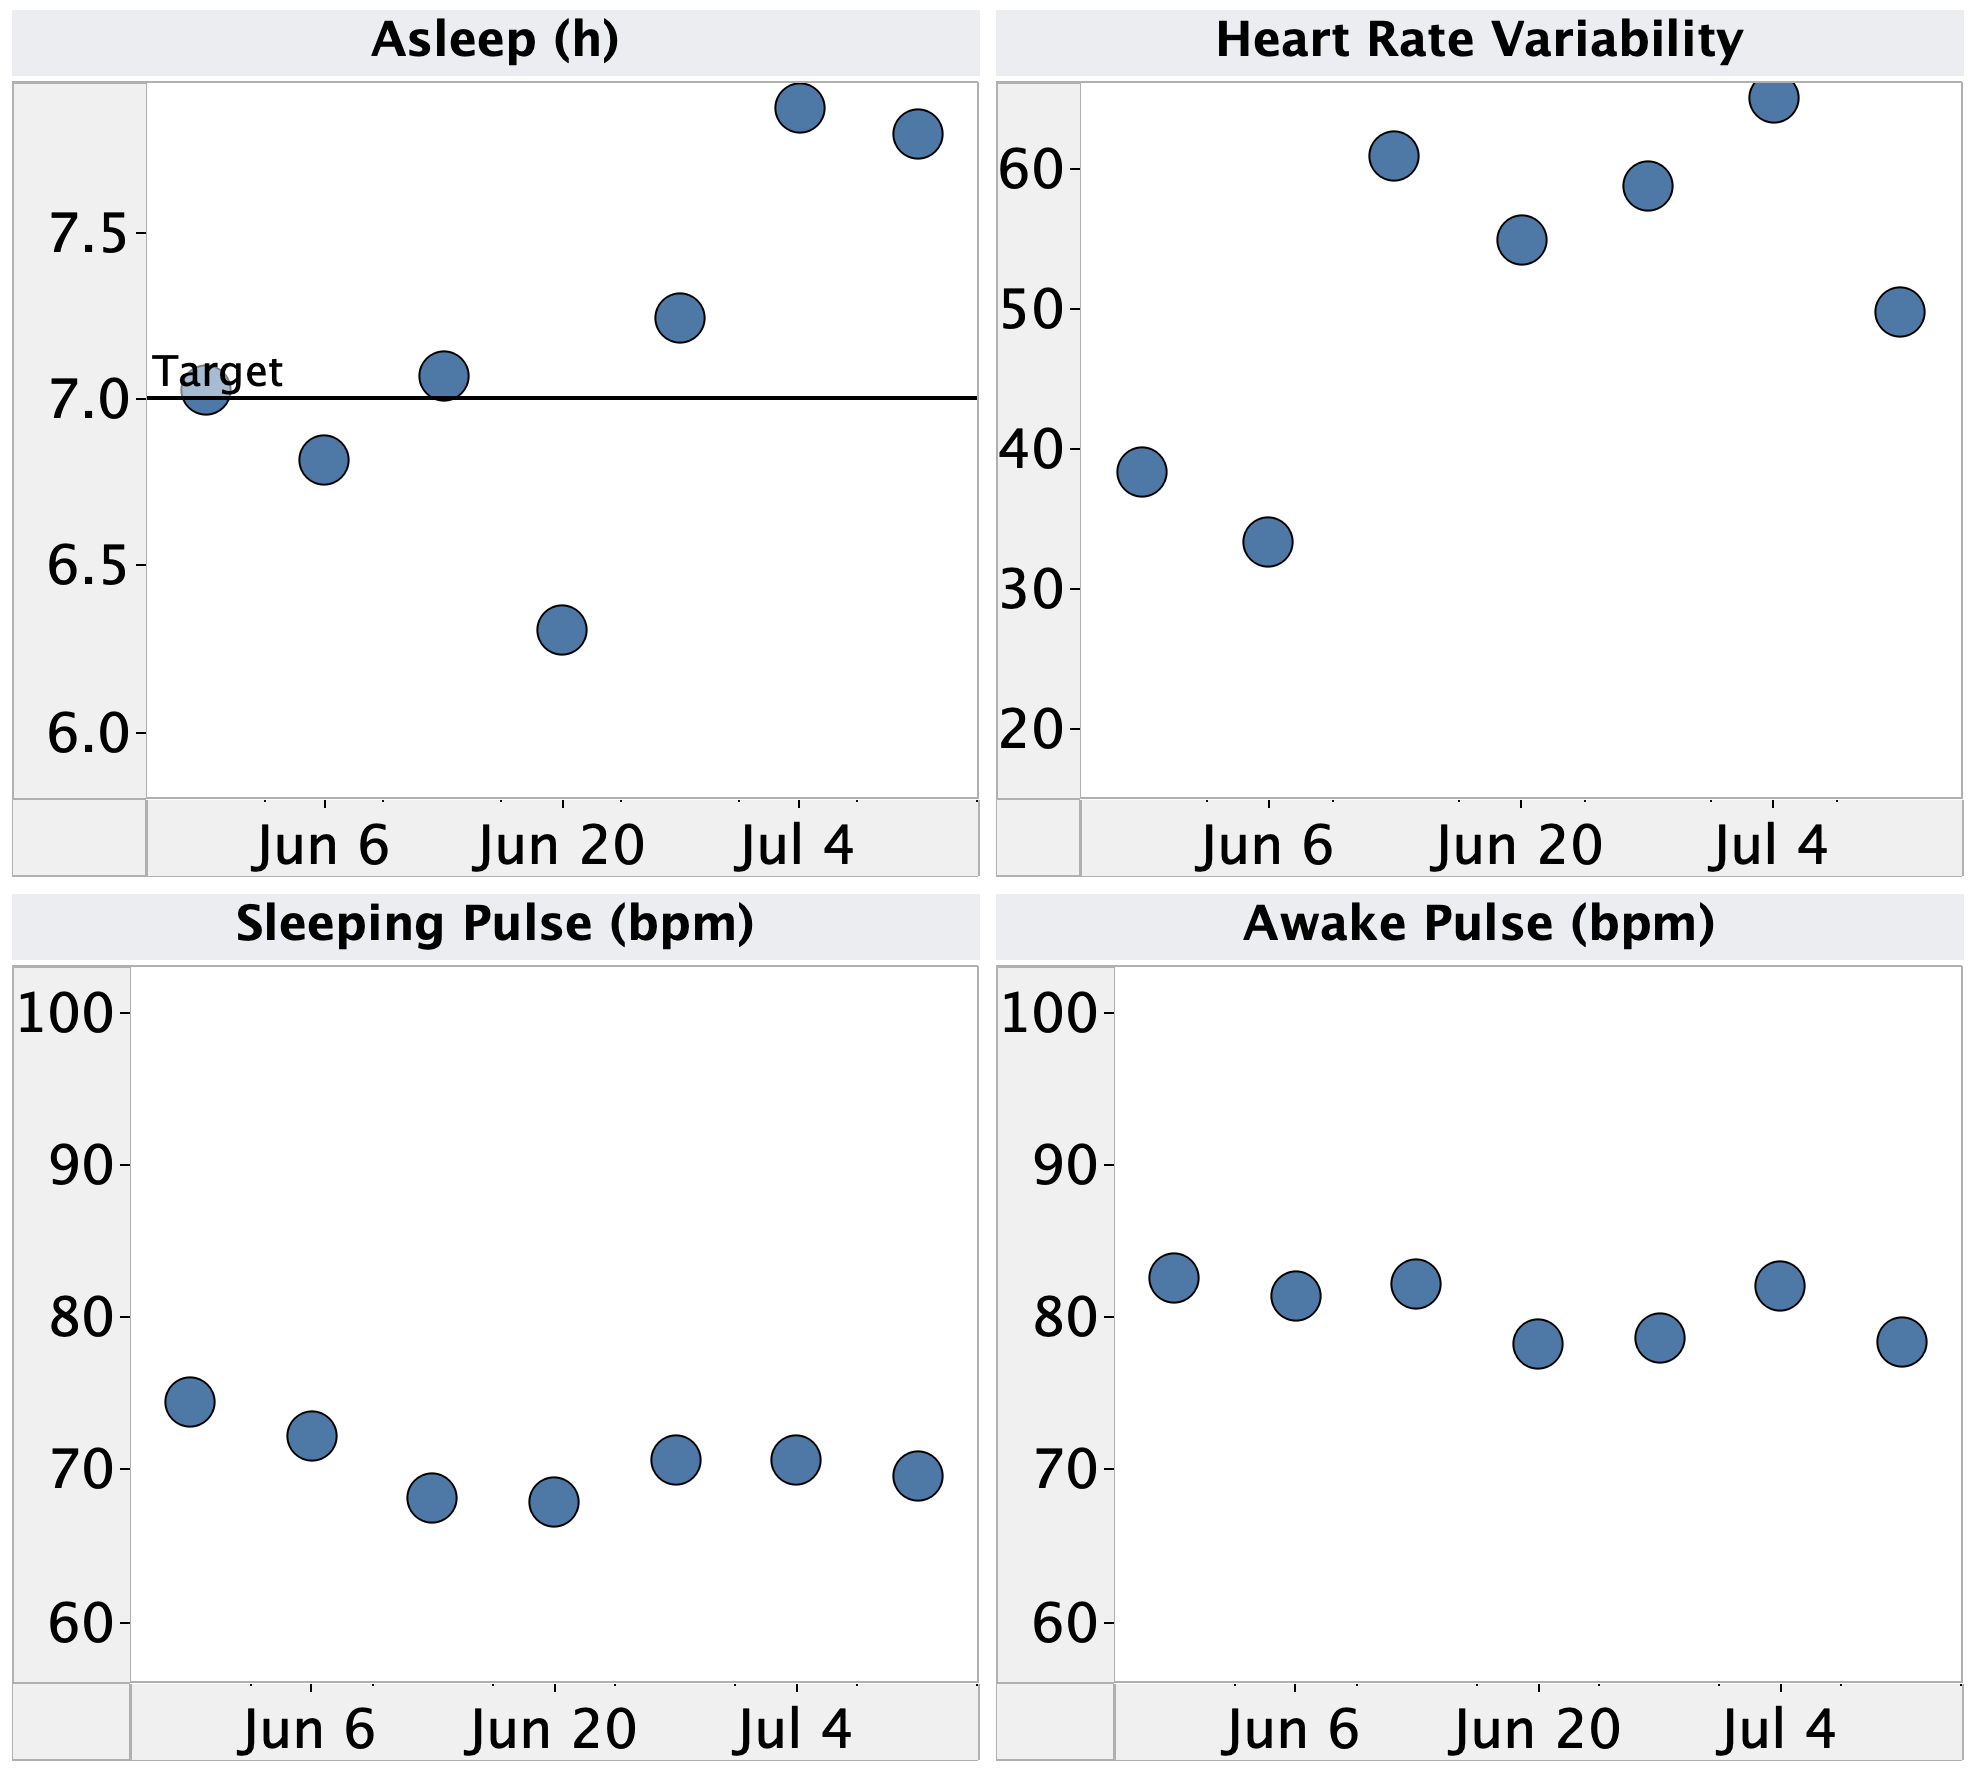
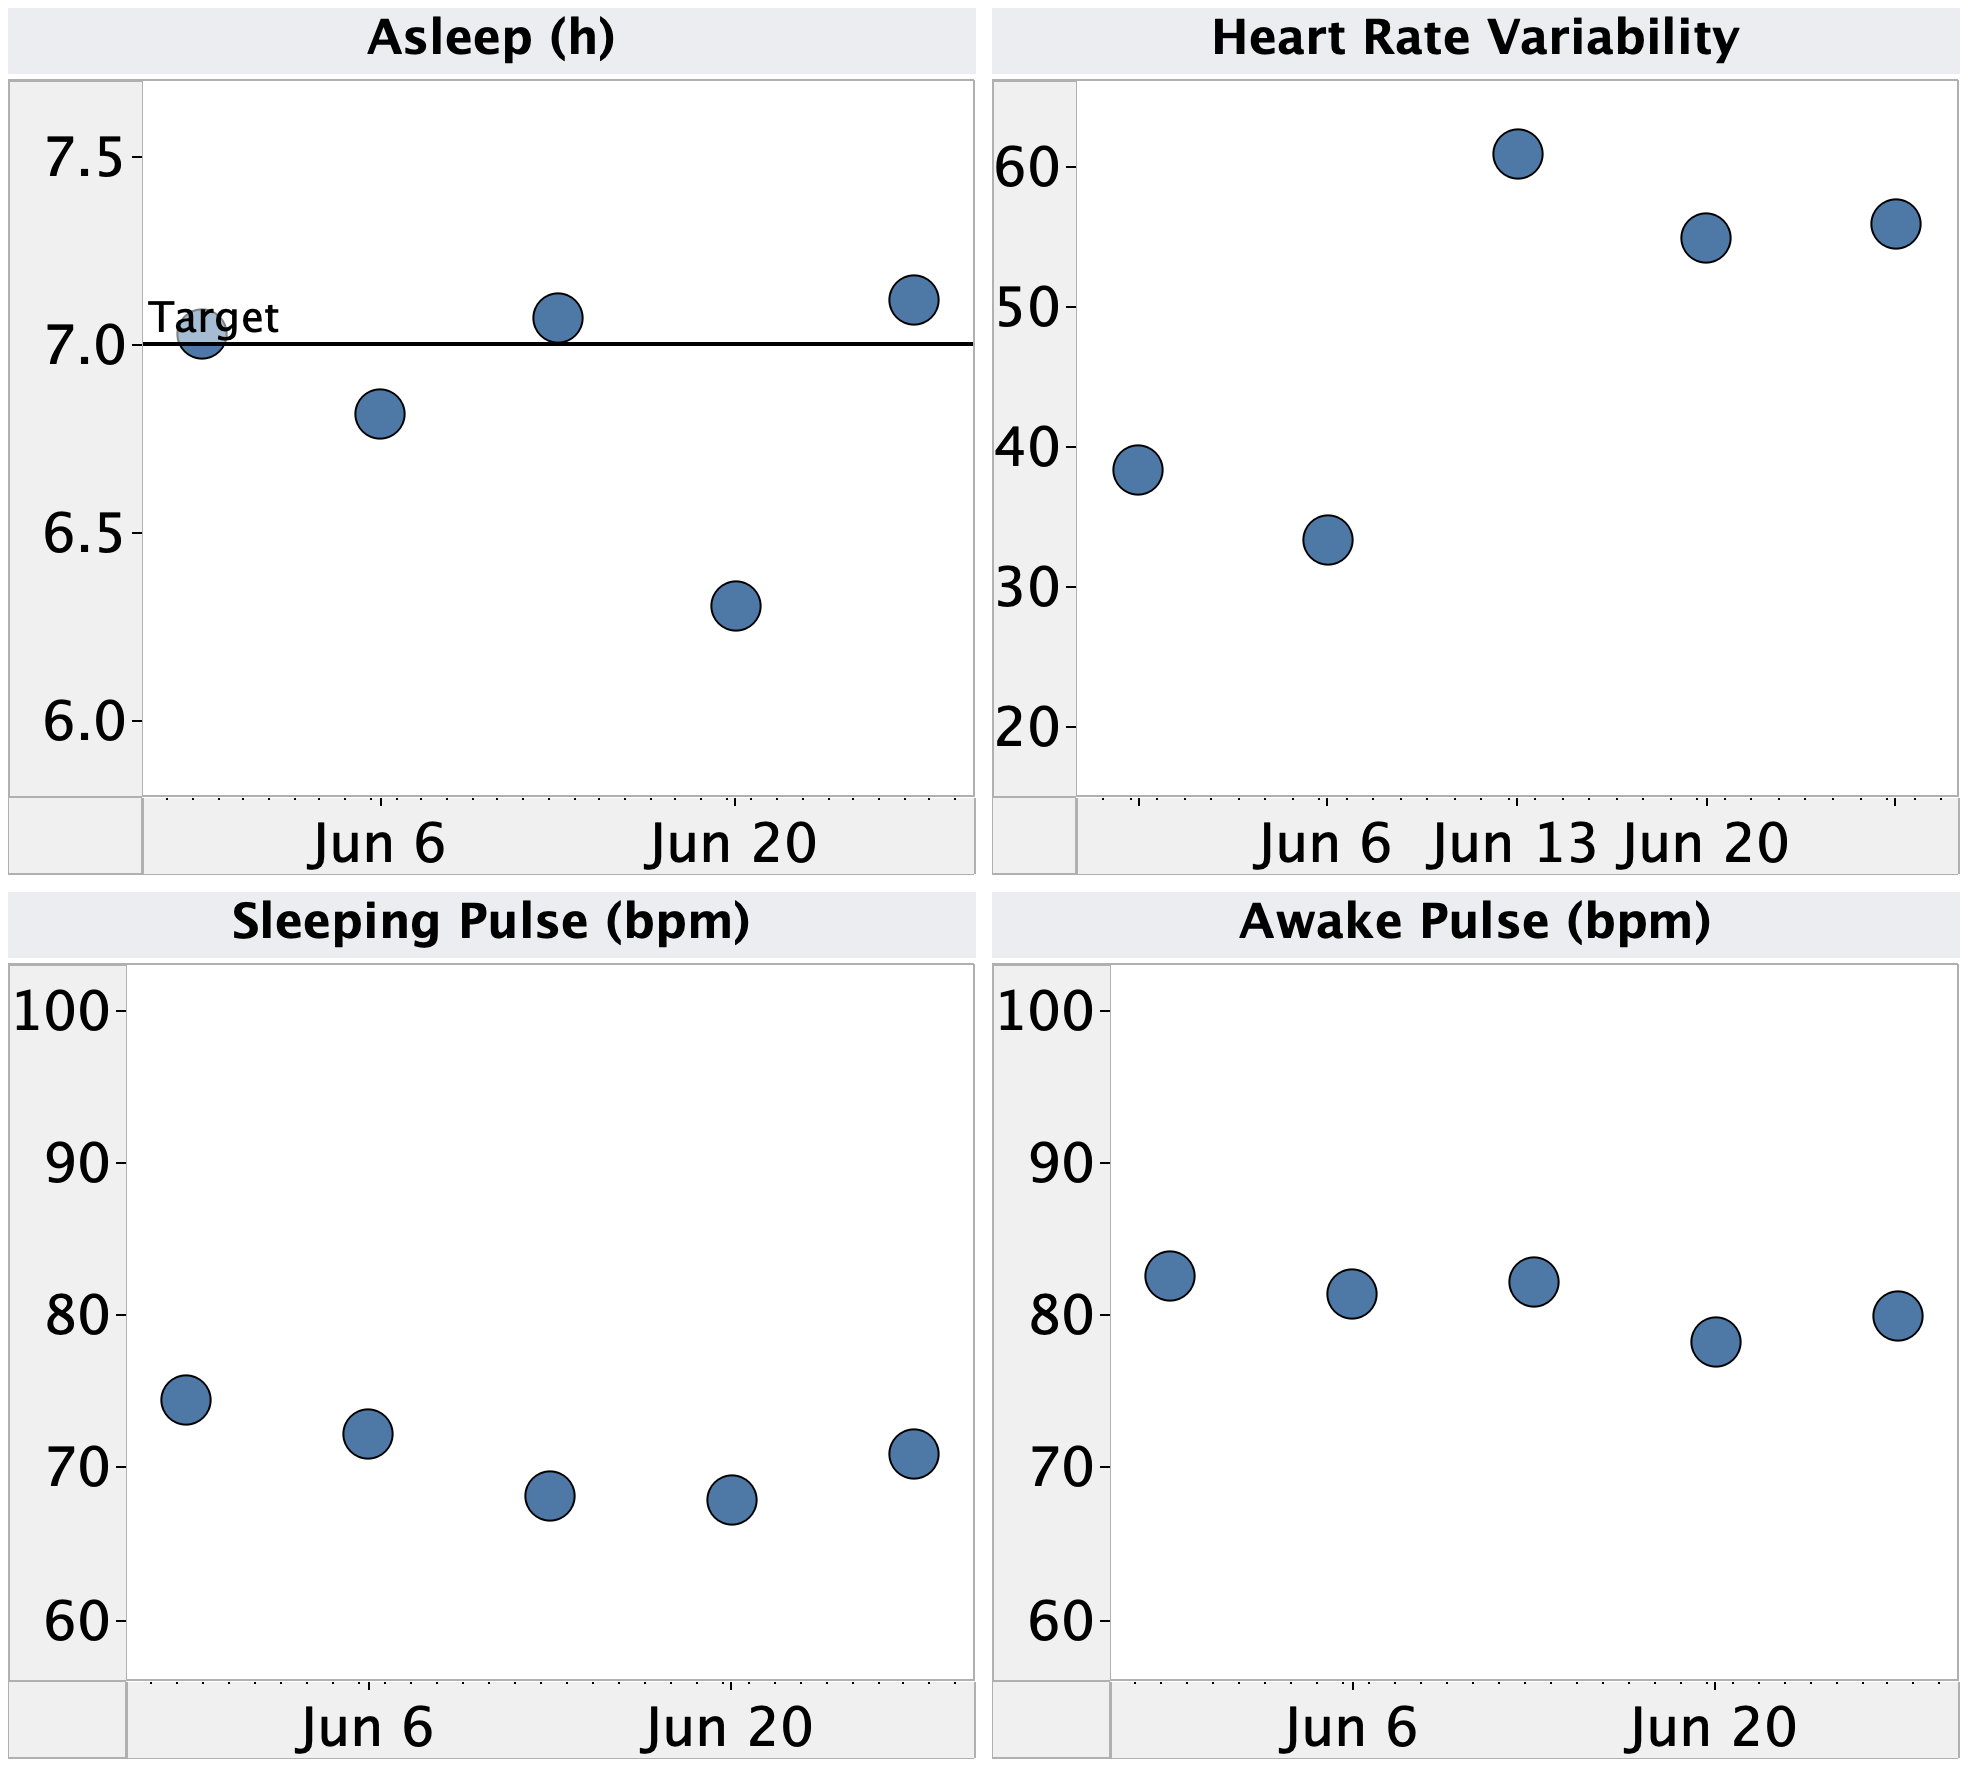
    • This was the first week of my sleep experiment, so in addition to the metrics automatically tracked by my watch, I’m noting down any time I wake up in the middle of the night.
    • Despite the fact that all the auto-tracked metrics looked good, I was waking up much more frequently in the middle of the night and feeling more tired. This suggests the auto-tracked metrics are not a great measure of overall sleep quality.
    • I need to do a more detailed analysis to figure out what’s going on here…
  • Blood glucose:
    • All stats back to normal after last week’s travel. 
    • Time 70-140 mg/dL still could be a bit better. Will continue to cut back on insulin at meals.
  • Body:
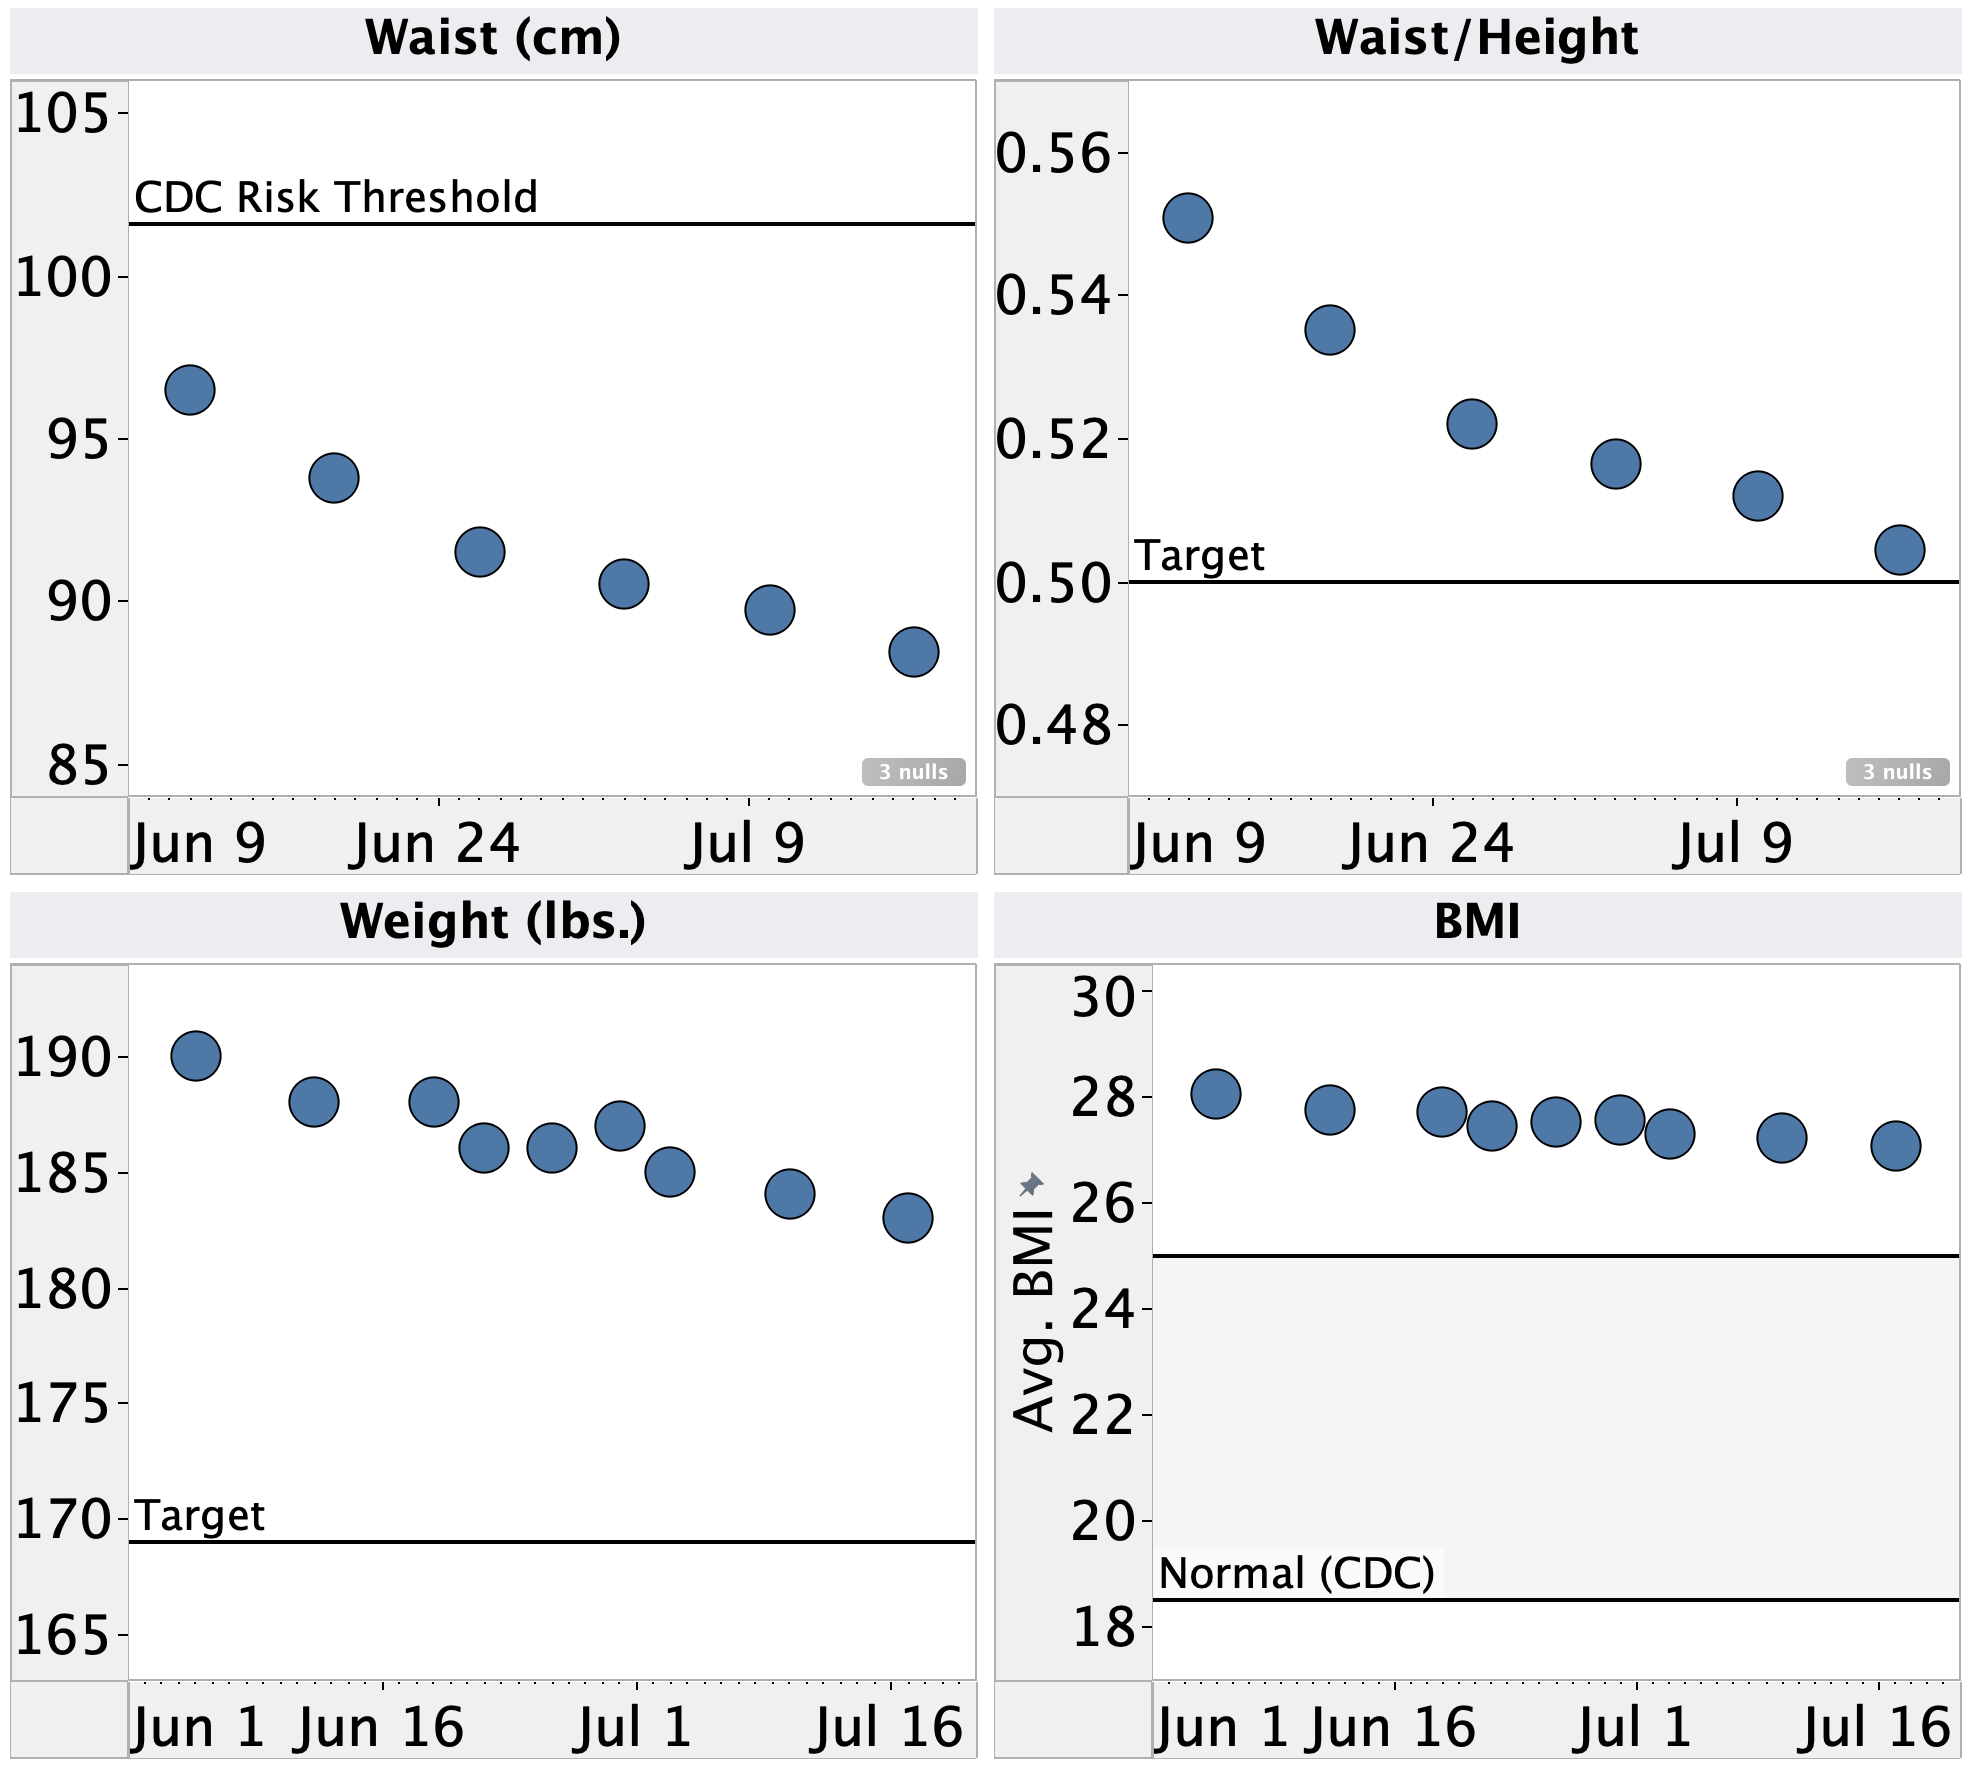
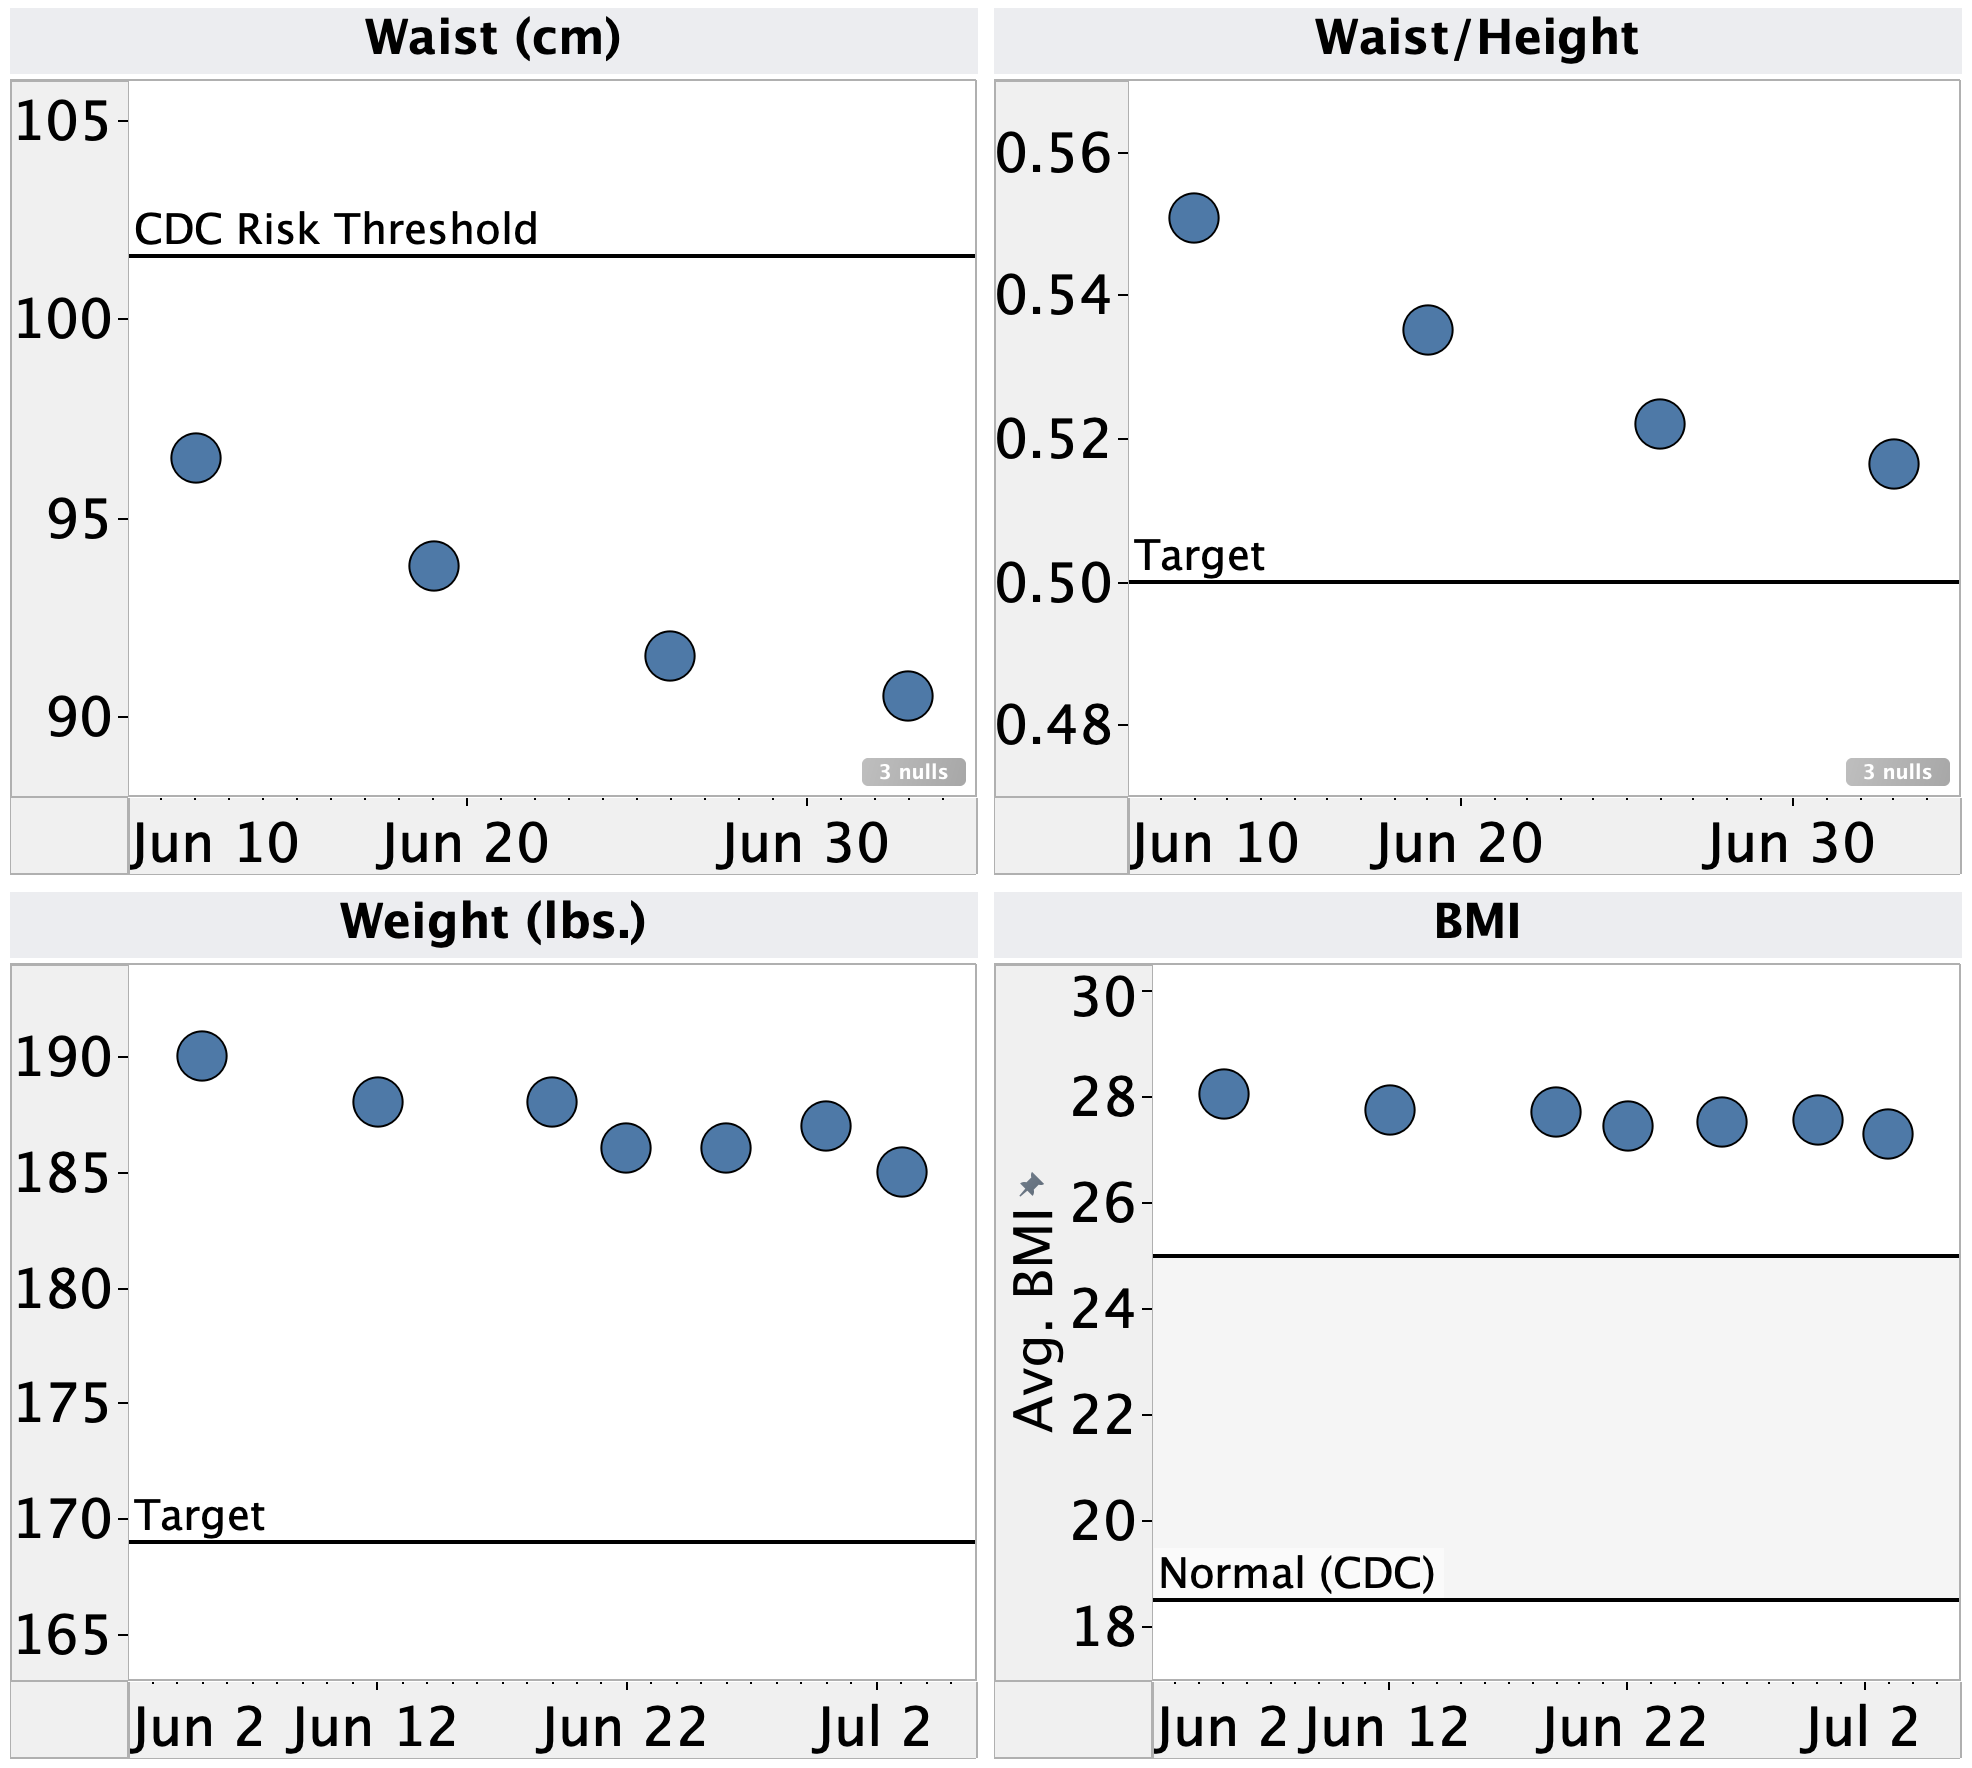
    • Still seeing steady drop in weight and waistline. I’m very happy with my progress here. 
  • Blood:
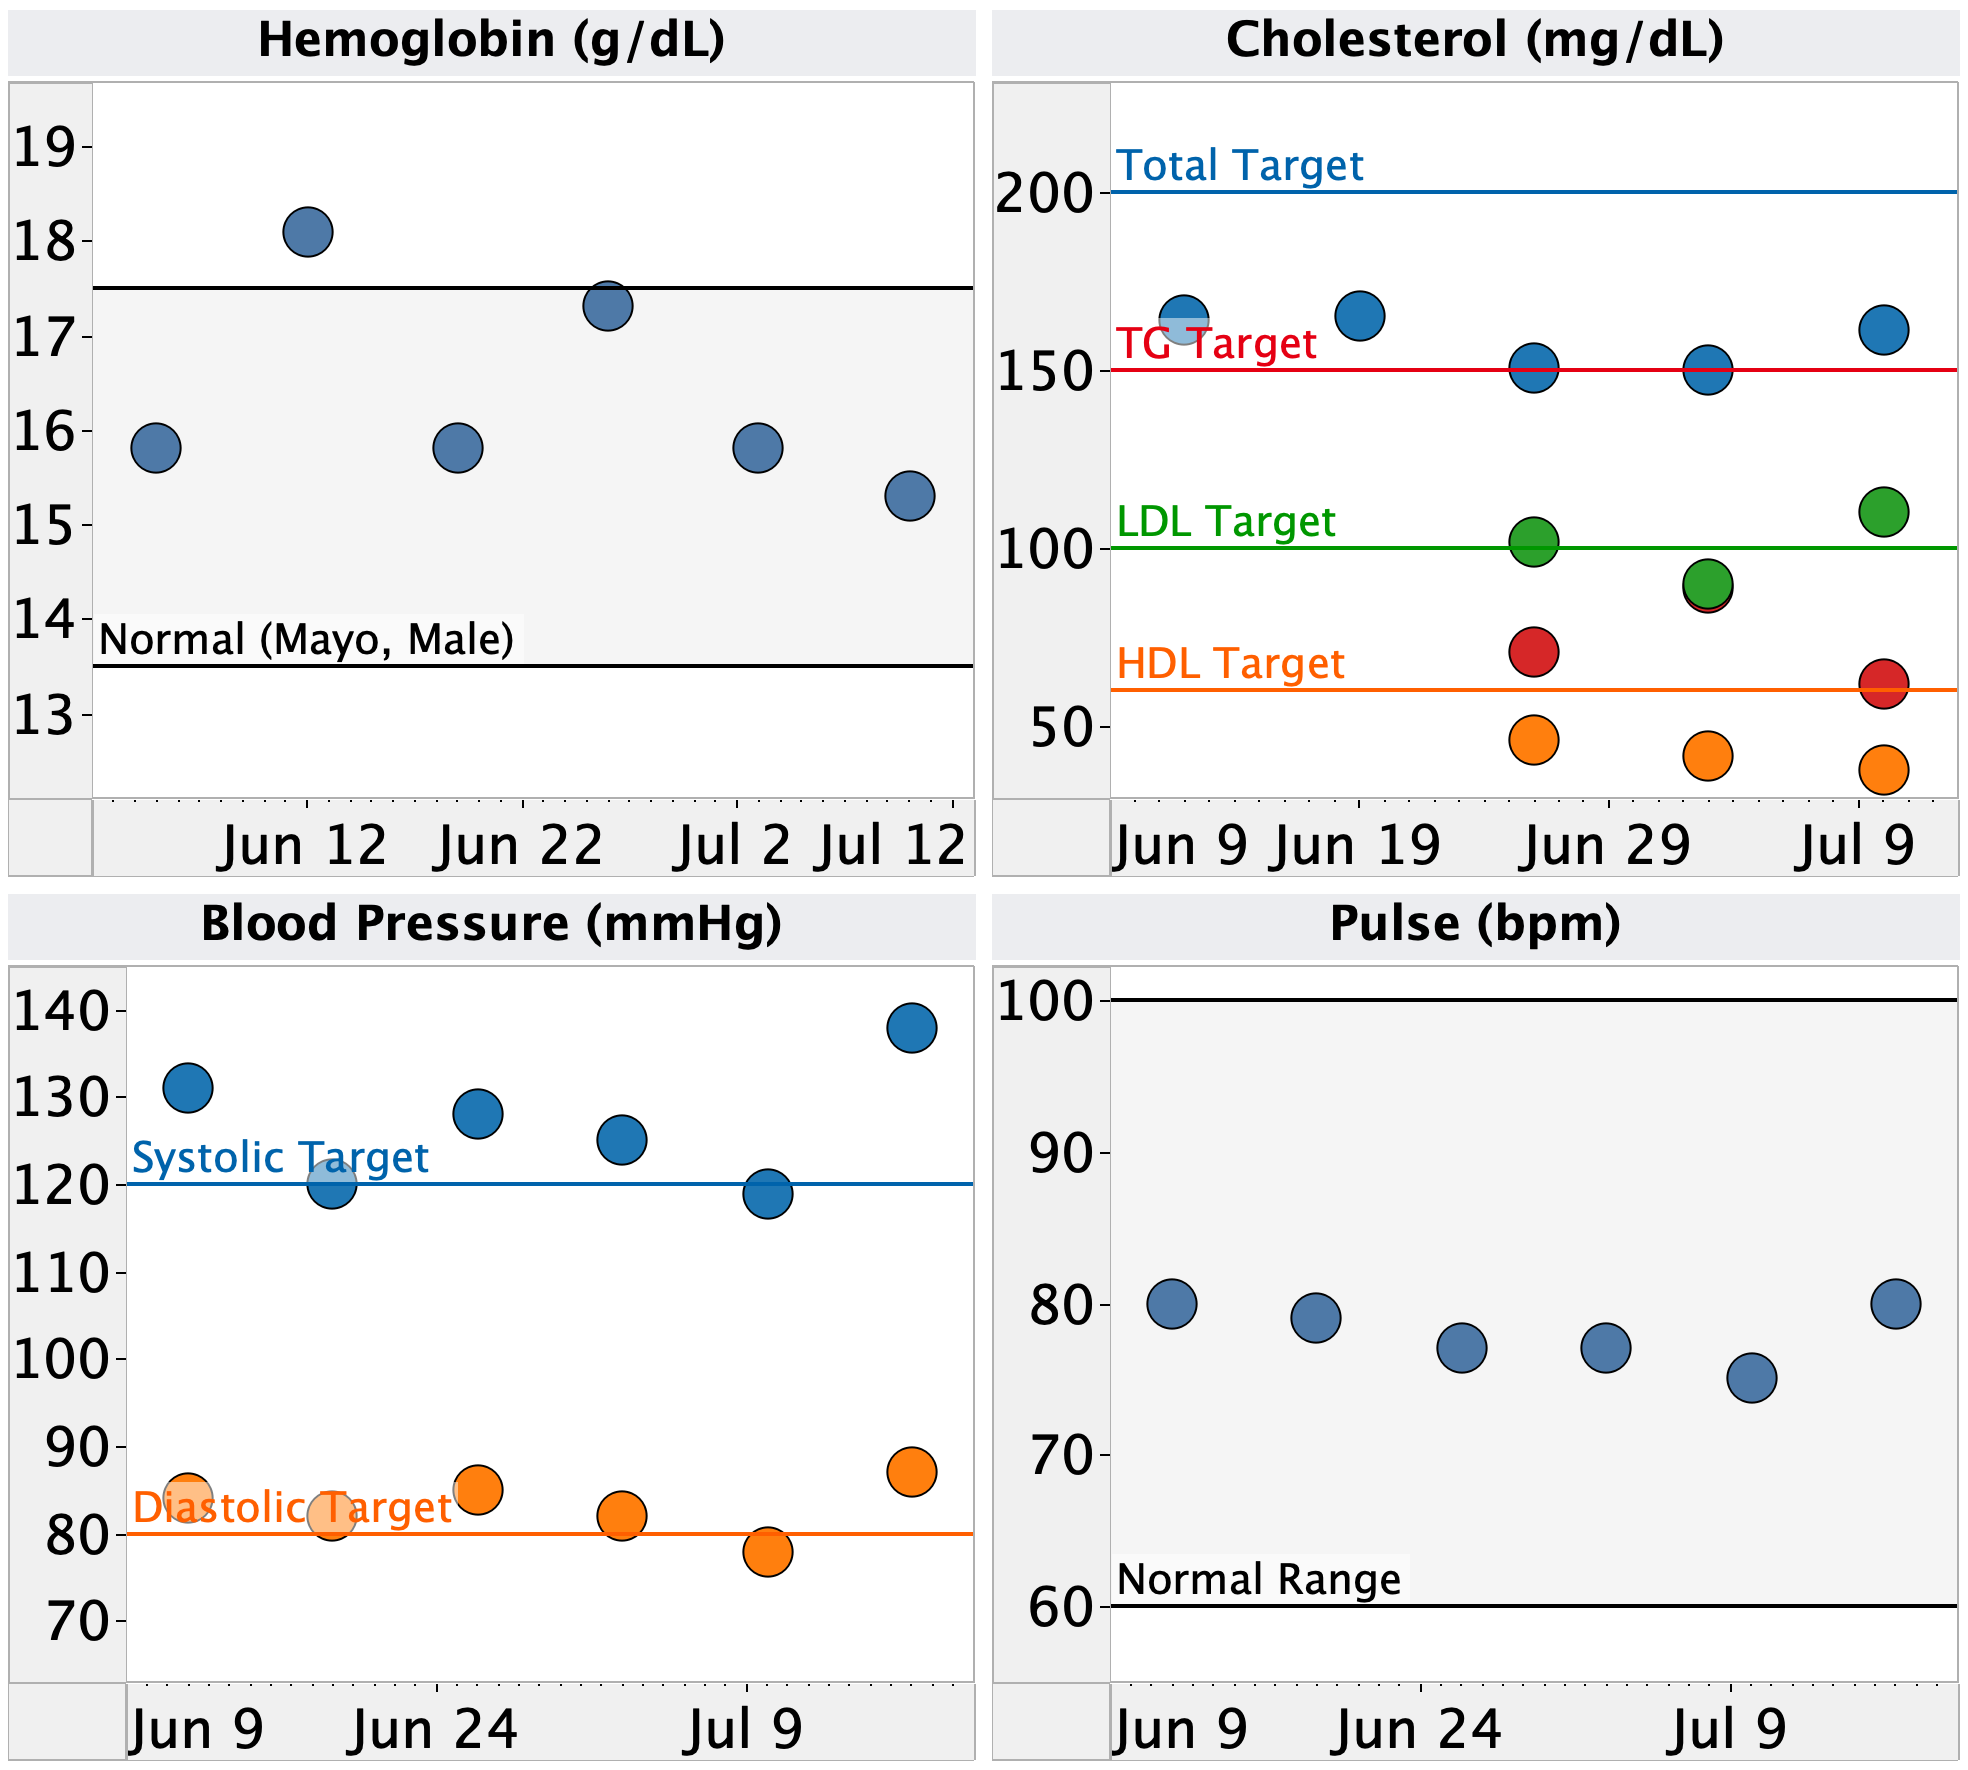
    • Switching to every other week measurement for cholesterol and hemoglobin to reduce tracking burden. Will increase frequency if I’m doing any experiments that might cause them to change.
    • Blood pressure was much higher than normal this week. I ate an unusual dinner last night and had higher than normal BG, so might just be an outlier. Will keep an eye on this and see if it persists.

Active & Planned Experiments

  • Comprehensive bloodwork:
    • Goal: Establish baseline for a broad range of biomarkers and check overall health
    • Approach: WellnessFX Premium panel
    • Status: Got the results, need to analyze and write up.
  • Testing methods of sleeping longer:
    • Goals:
      • To determine if taking melatonin supplements in the evening extends the duration of my time asleep and subjective fatigue given a consistent bedtime.
      • To determine if taking melatonin supplement and/or sleeping longer affects subjective fatigue, blood glucose, heart rate variability, or pulse
    • Approach: here
    • Status: Week 1 complete

Data:

Blood

Body

Sleep

Methods:

Measurements: See summary section above

Data Processing & Visualization. Data was visualized using Tableau.

Data: here


– QD


Get new posts by email or rss feed

Weekly Health Statistics: 7/4 – 7/10/21

Get new posts by email or rss feed


For those checking the dates, I’m posting these with a 1-week lag. 

Summary:

What I’m tracking

  • Sleep: 
    • Method: Apple watch + Autosleep app
    • Metrics: total time, heart rate variability, pulse (sleeping vs. waking)
  • Blood glucose:
    • Method: Dexcom G6 CGM
    • Metrics: fasting BG, Avg. BG, coefficient of variation, time 70-140 mg/dL, time <60 mg/dL
  • Body:
  • Other blood:
  • Urine:
    • Method: Vessel
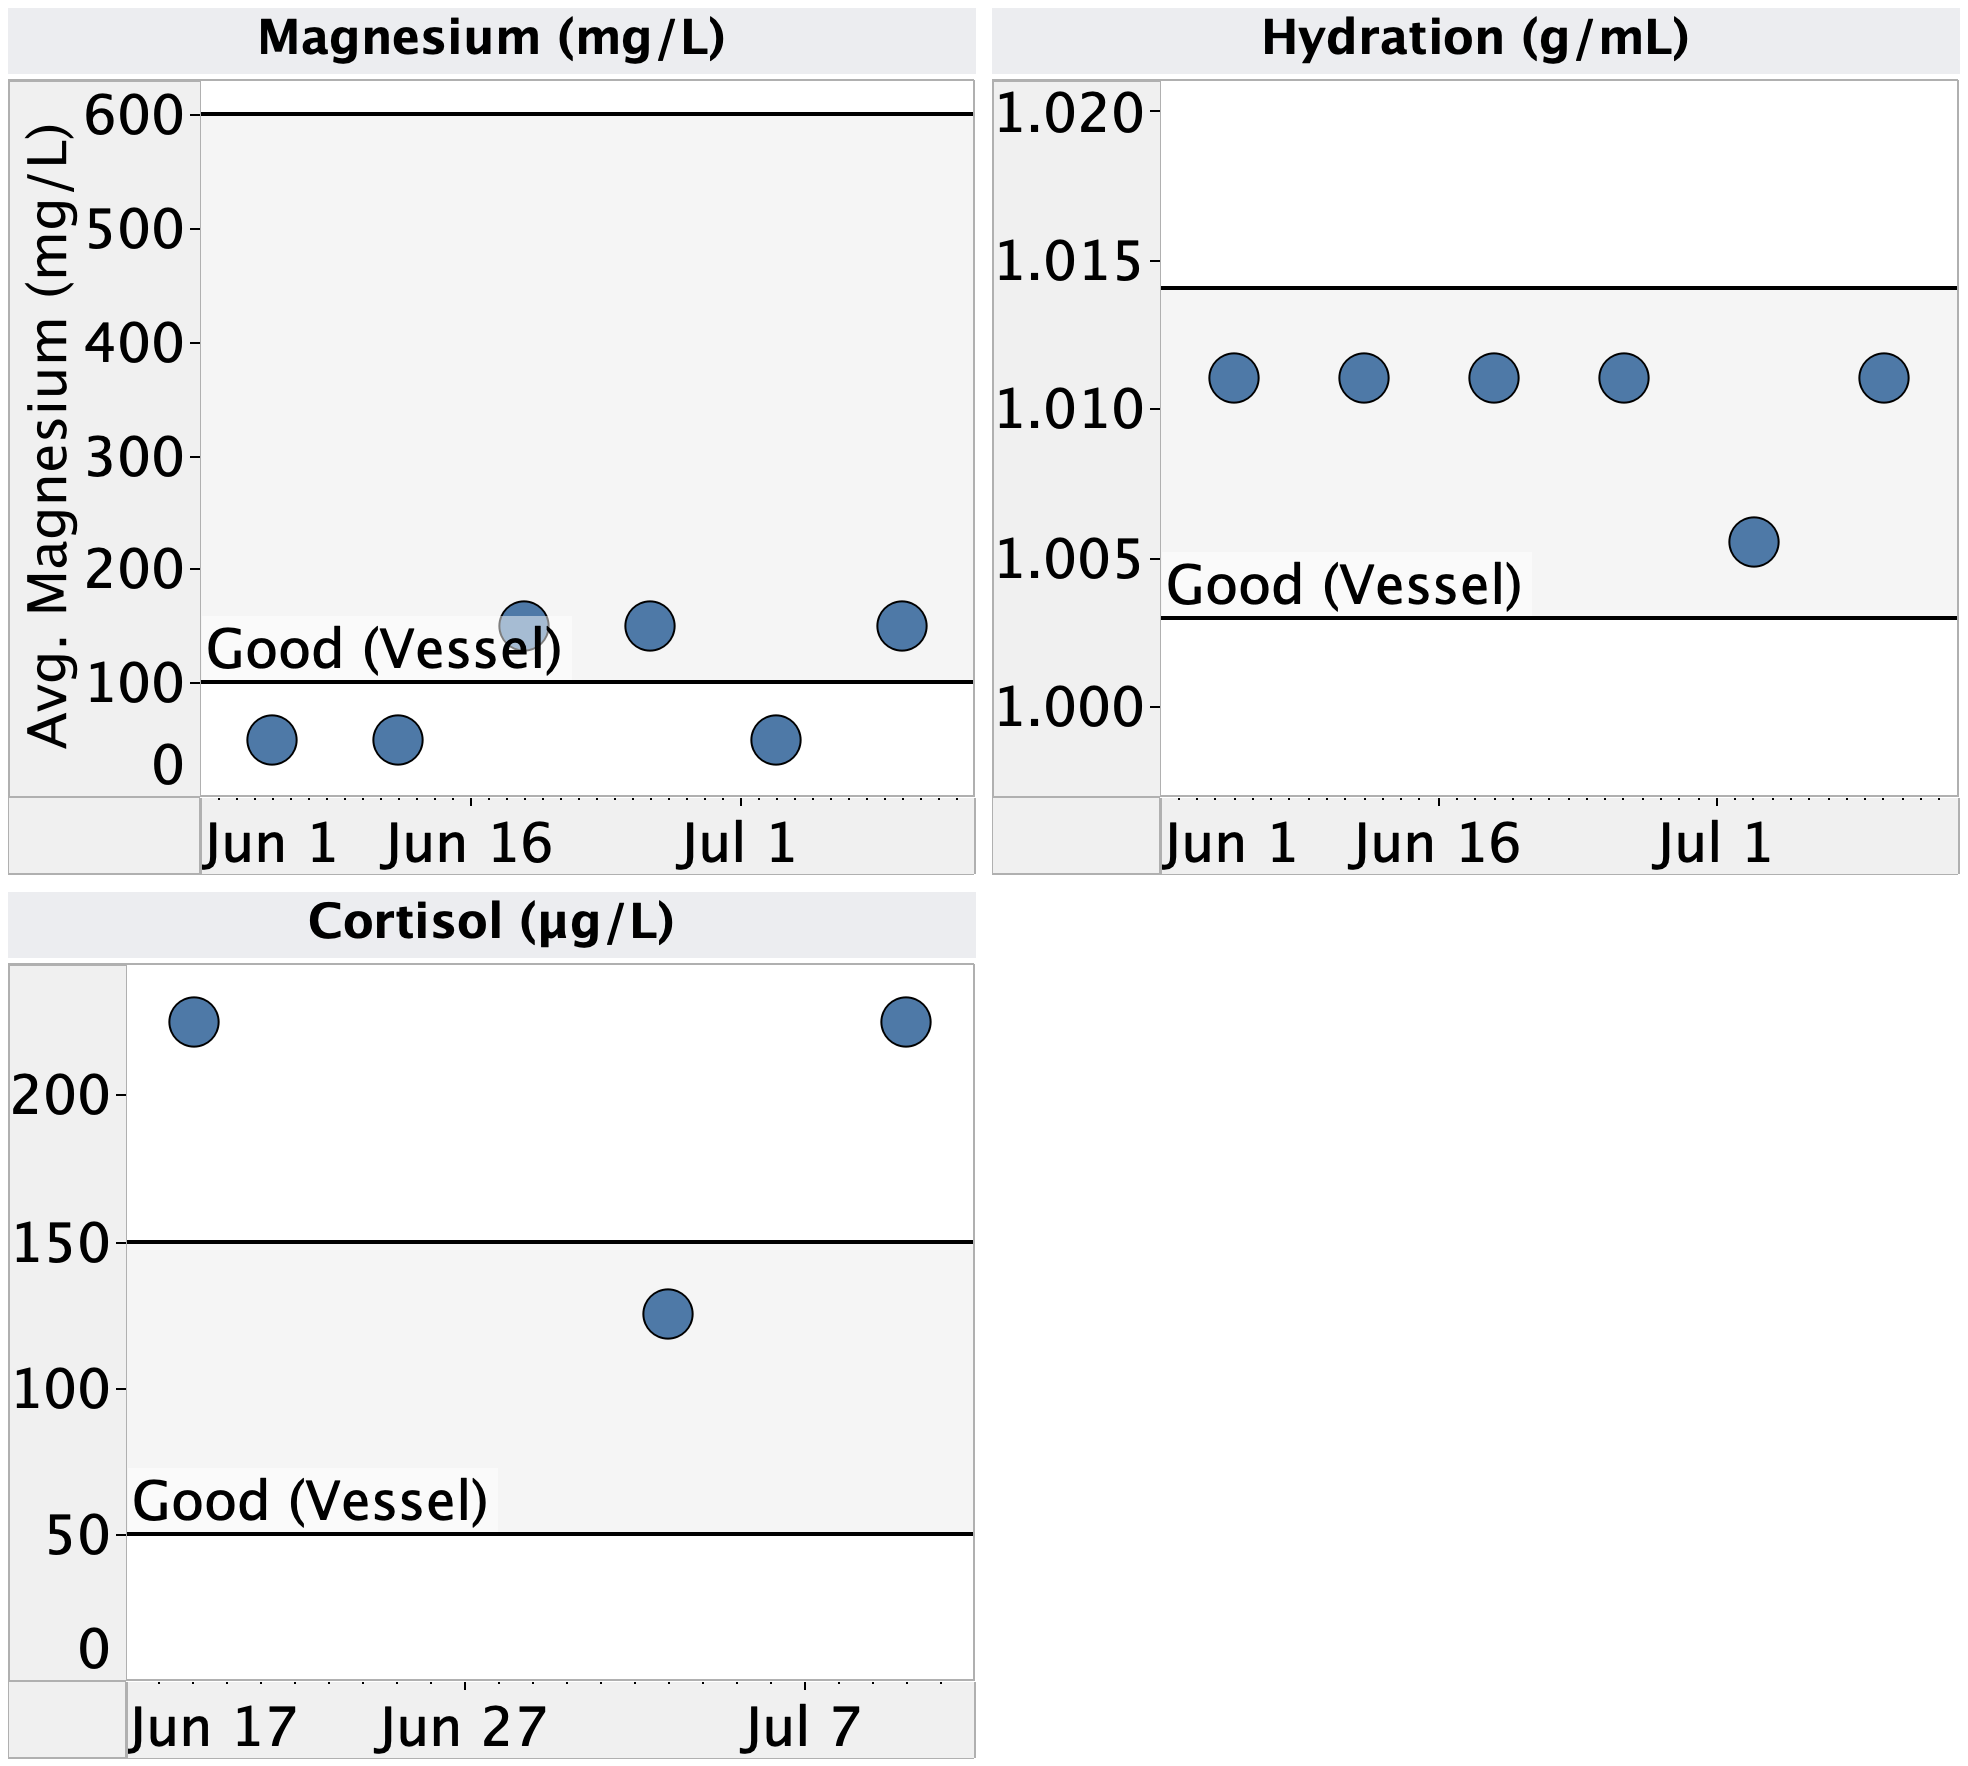
    • Metrics: biotin, ketones, pH, vitamin C, magnesium, hydration, & cortisol

Observations

  • Sleep:
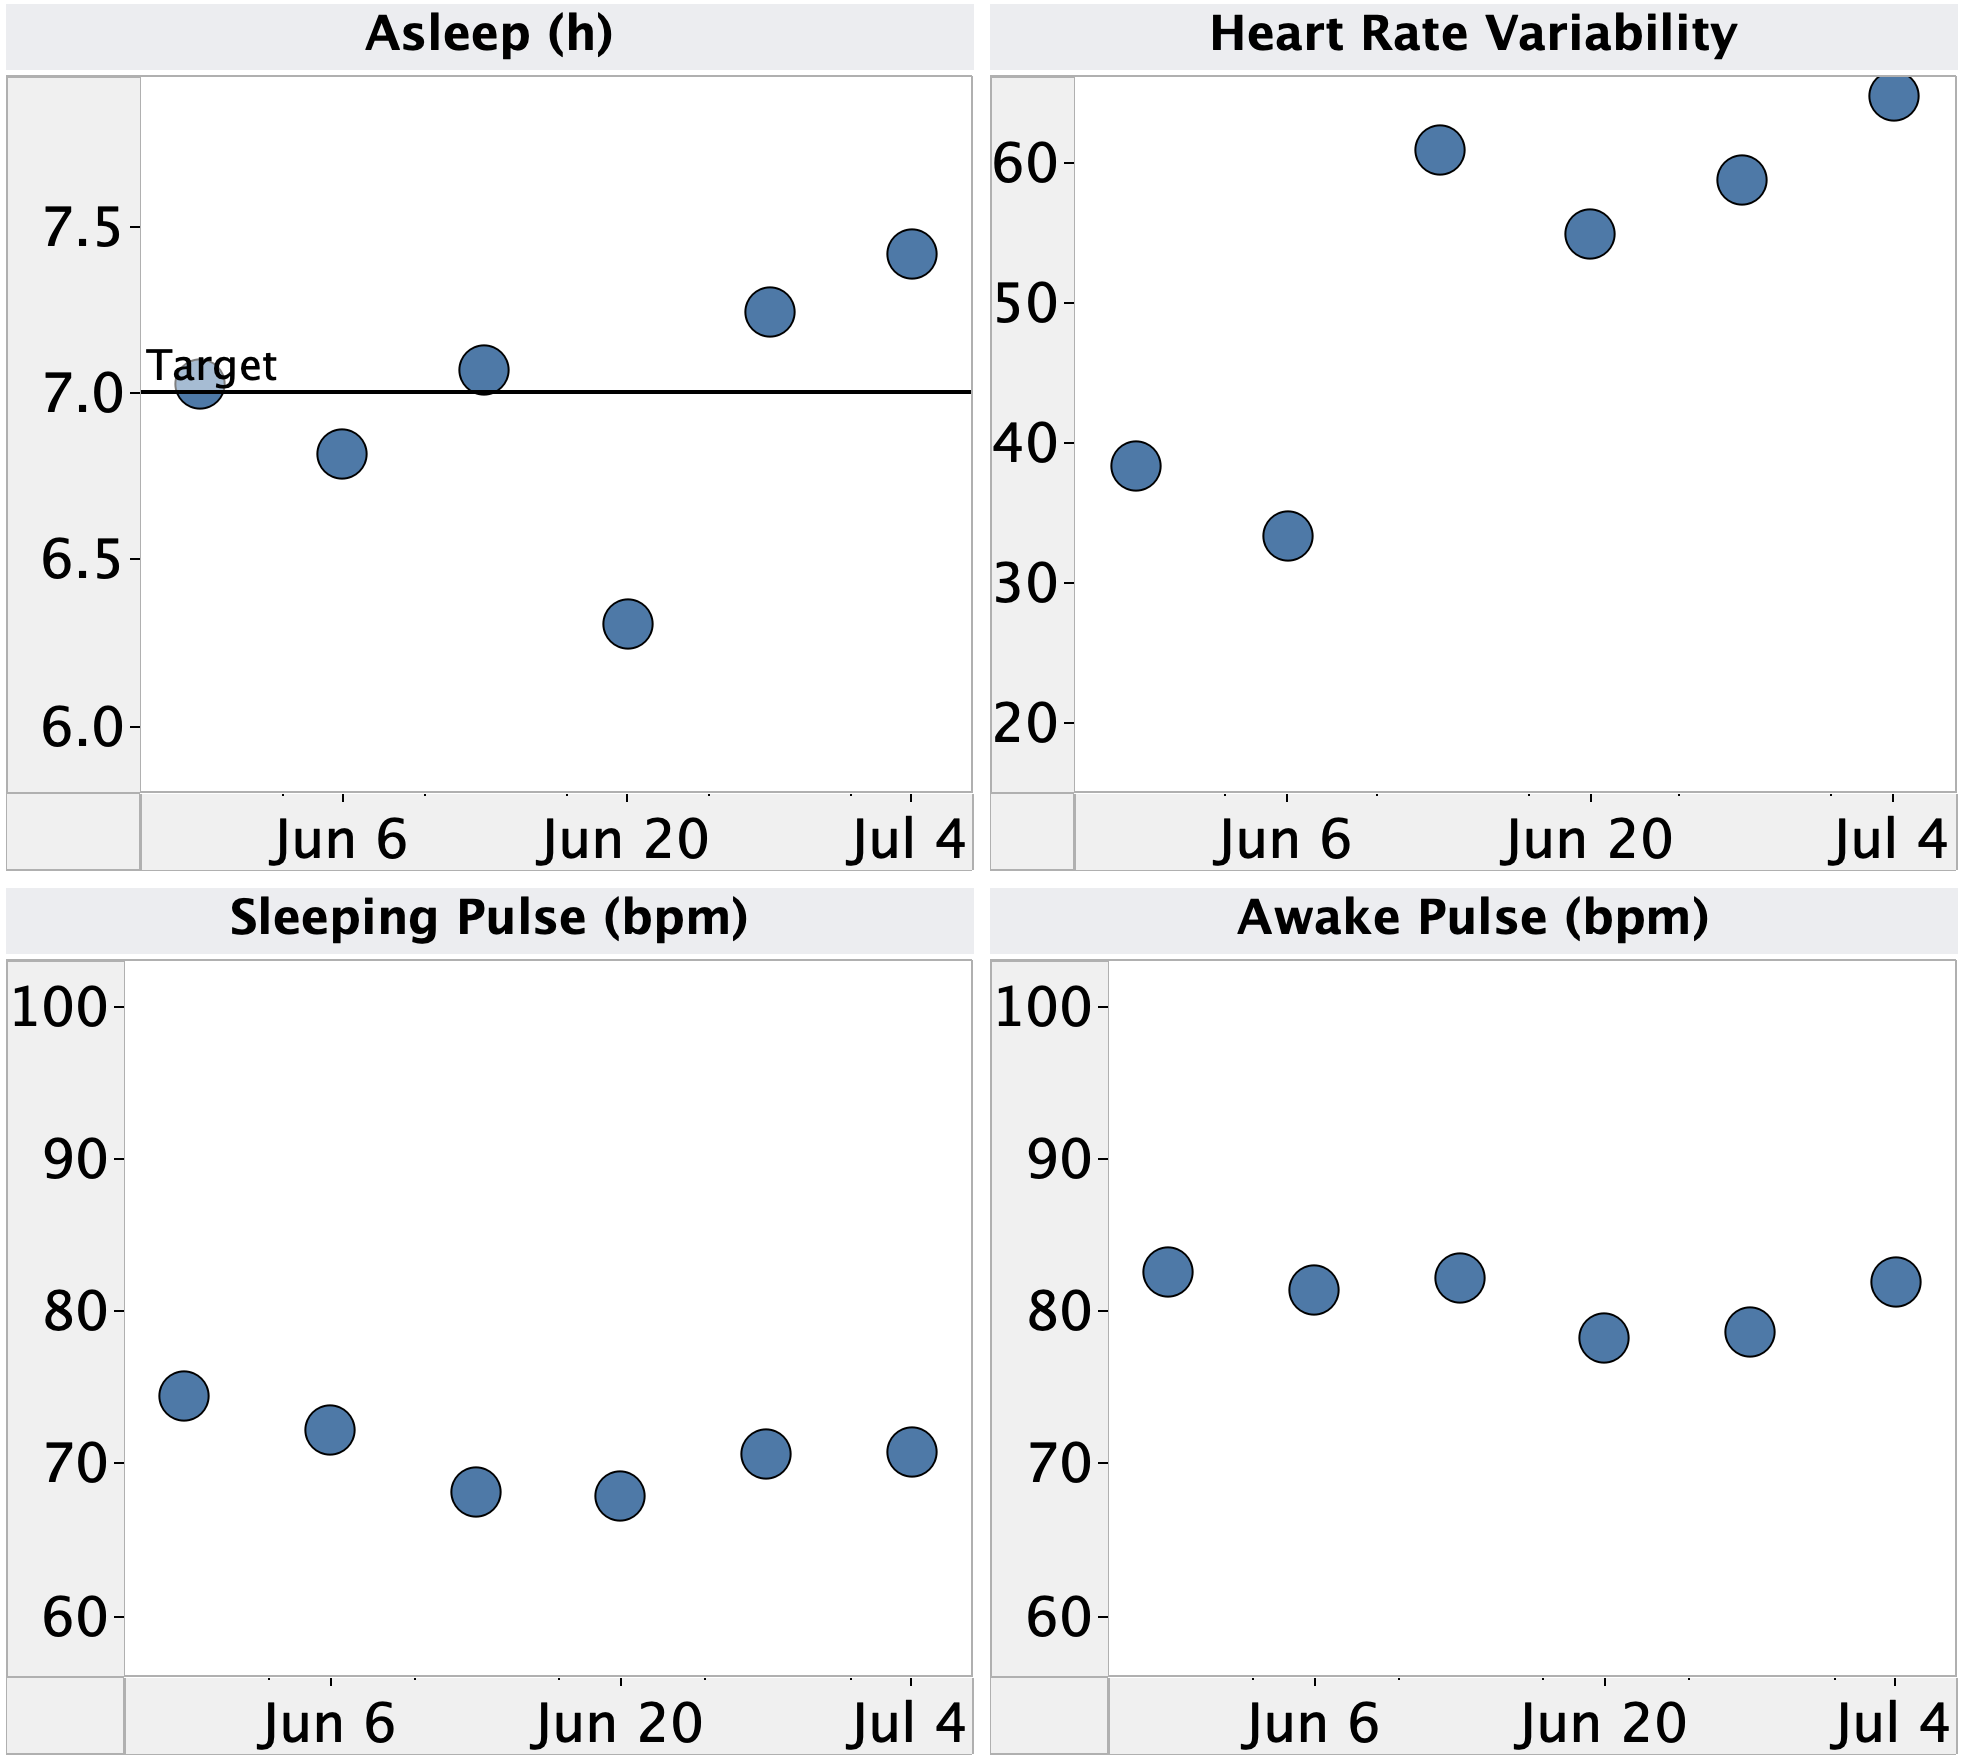
    • Sleep improved again this week, despite traveling Monday-Wednesday and I continue to feel much better/less tired than before I started going to bed at a consistent time.
    • Still noticing that I’m waking up earlier than preferred, though it’s not always showing up in the data (probably b/c I stay in bed trying to go back to sleep). I’m starting an experiment this week to test ways to stay asleep longer, so I’ll need to make sure I measure wake-up time correctly.
  • Blood glucose:
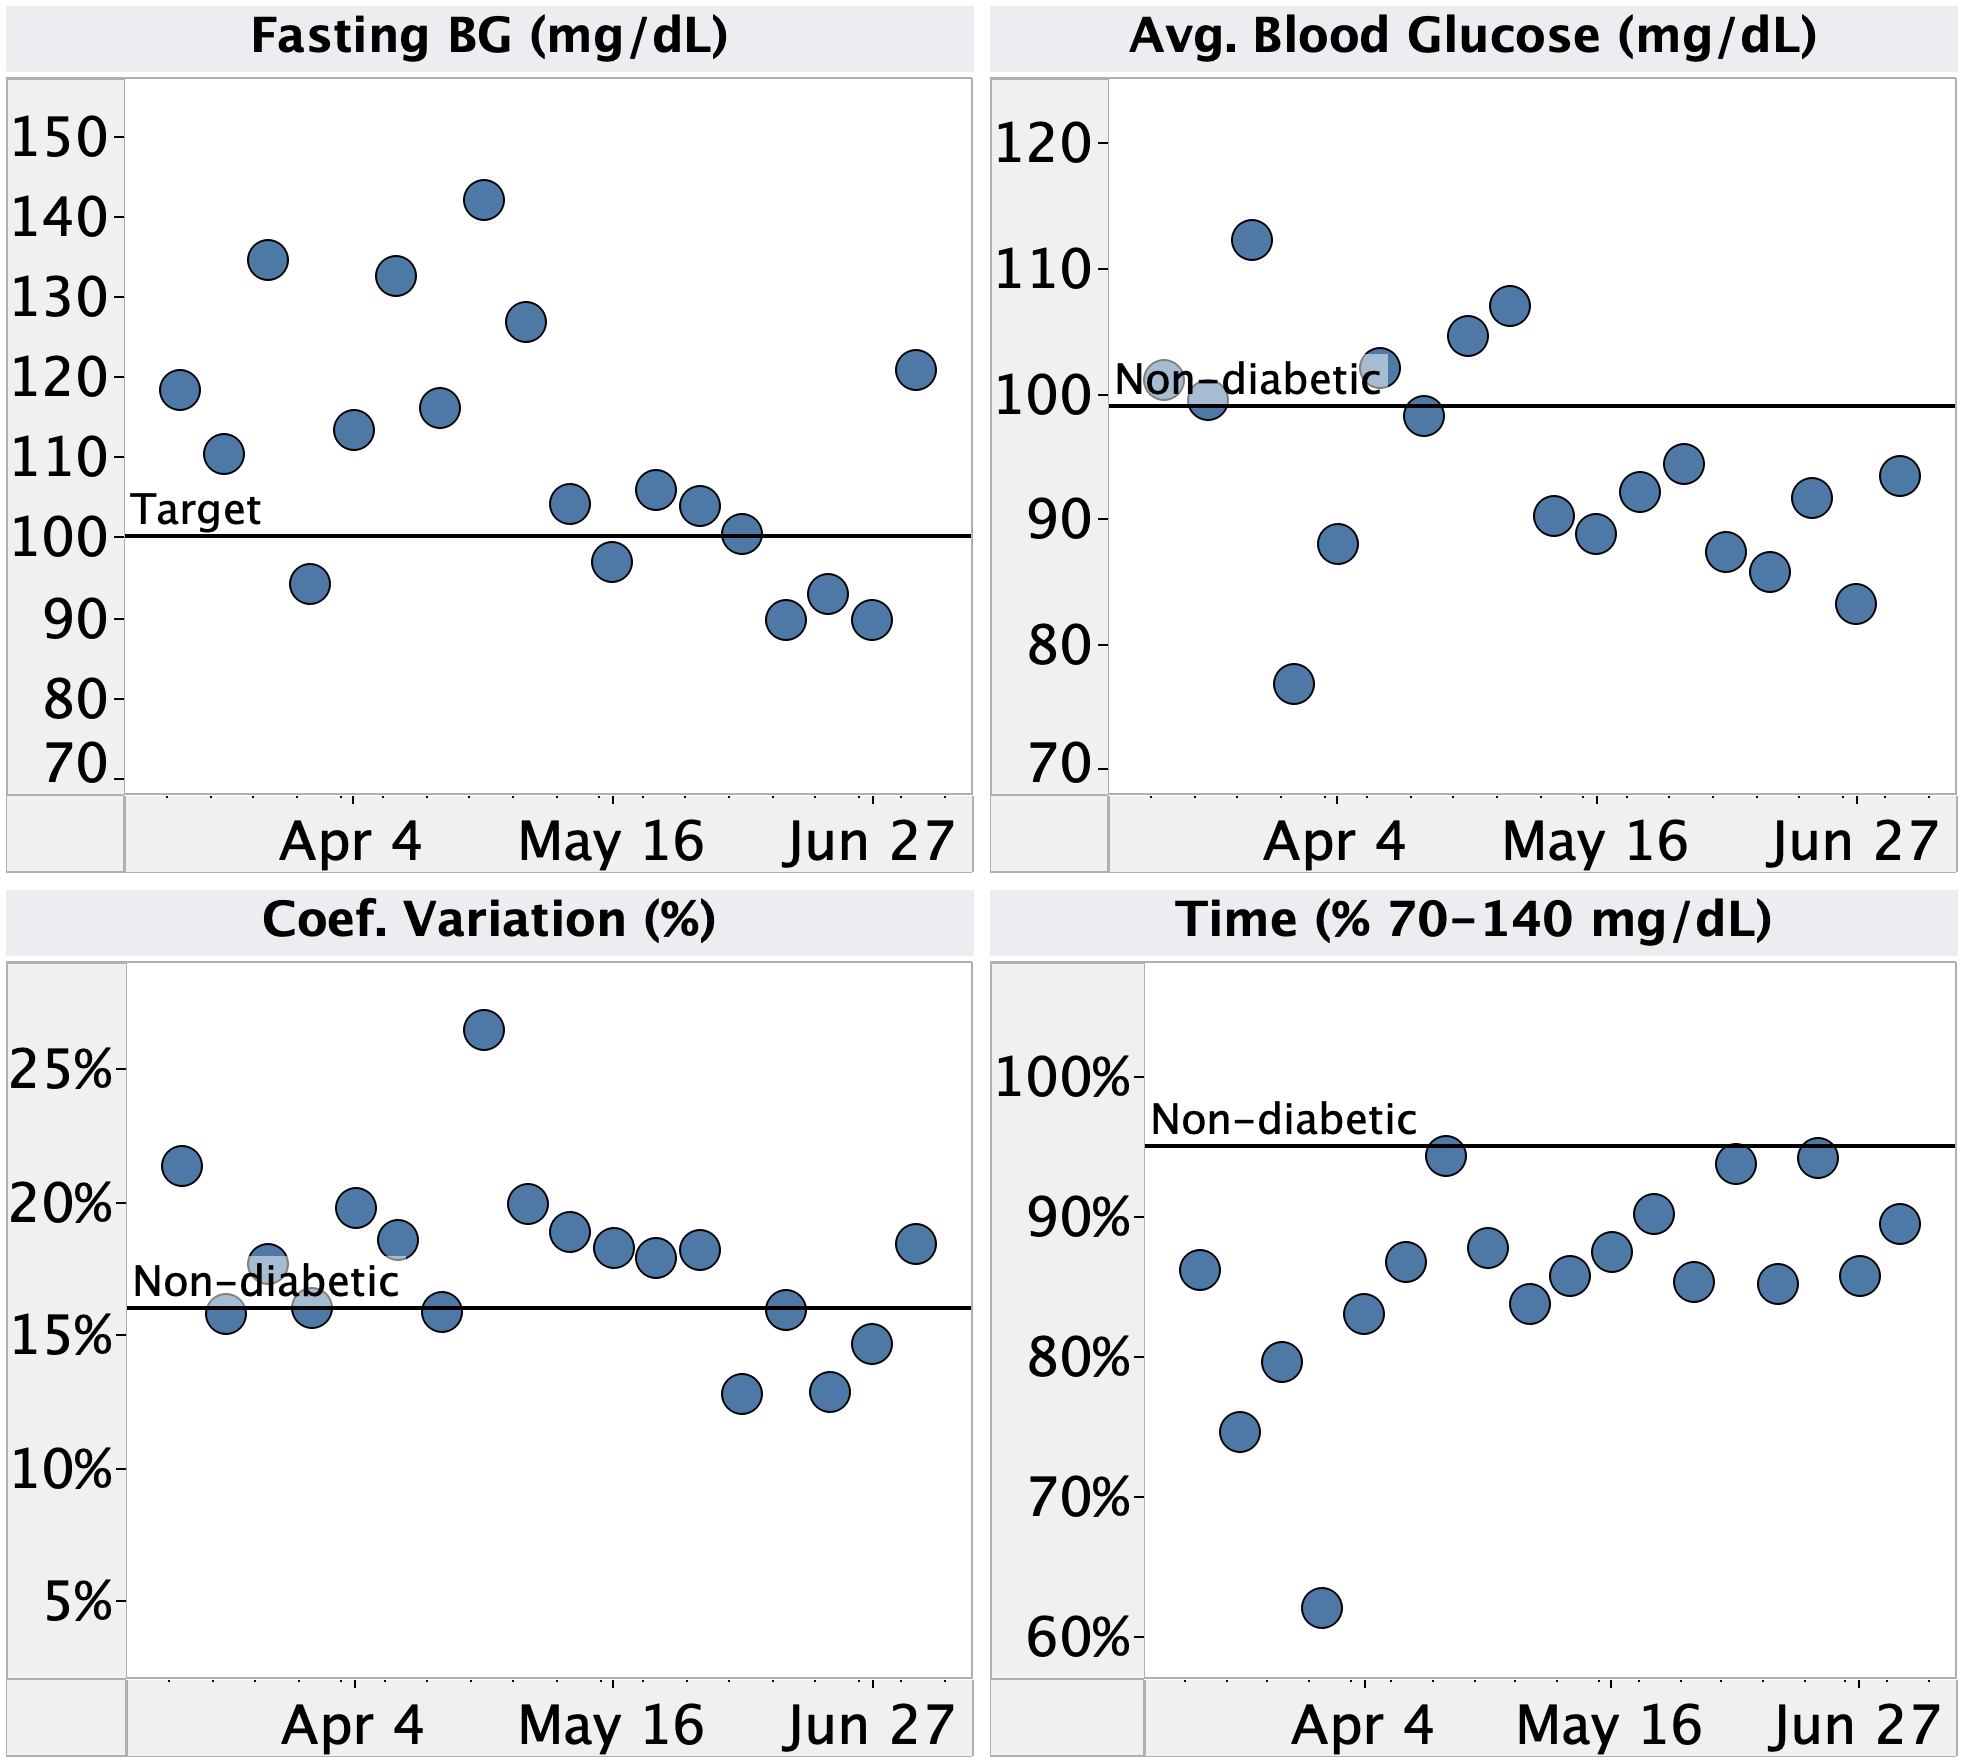
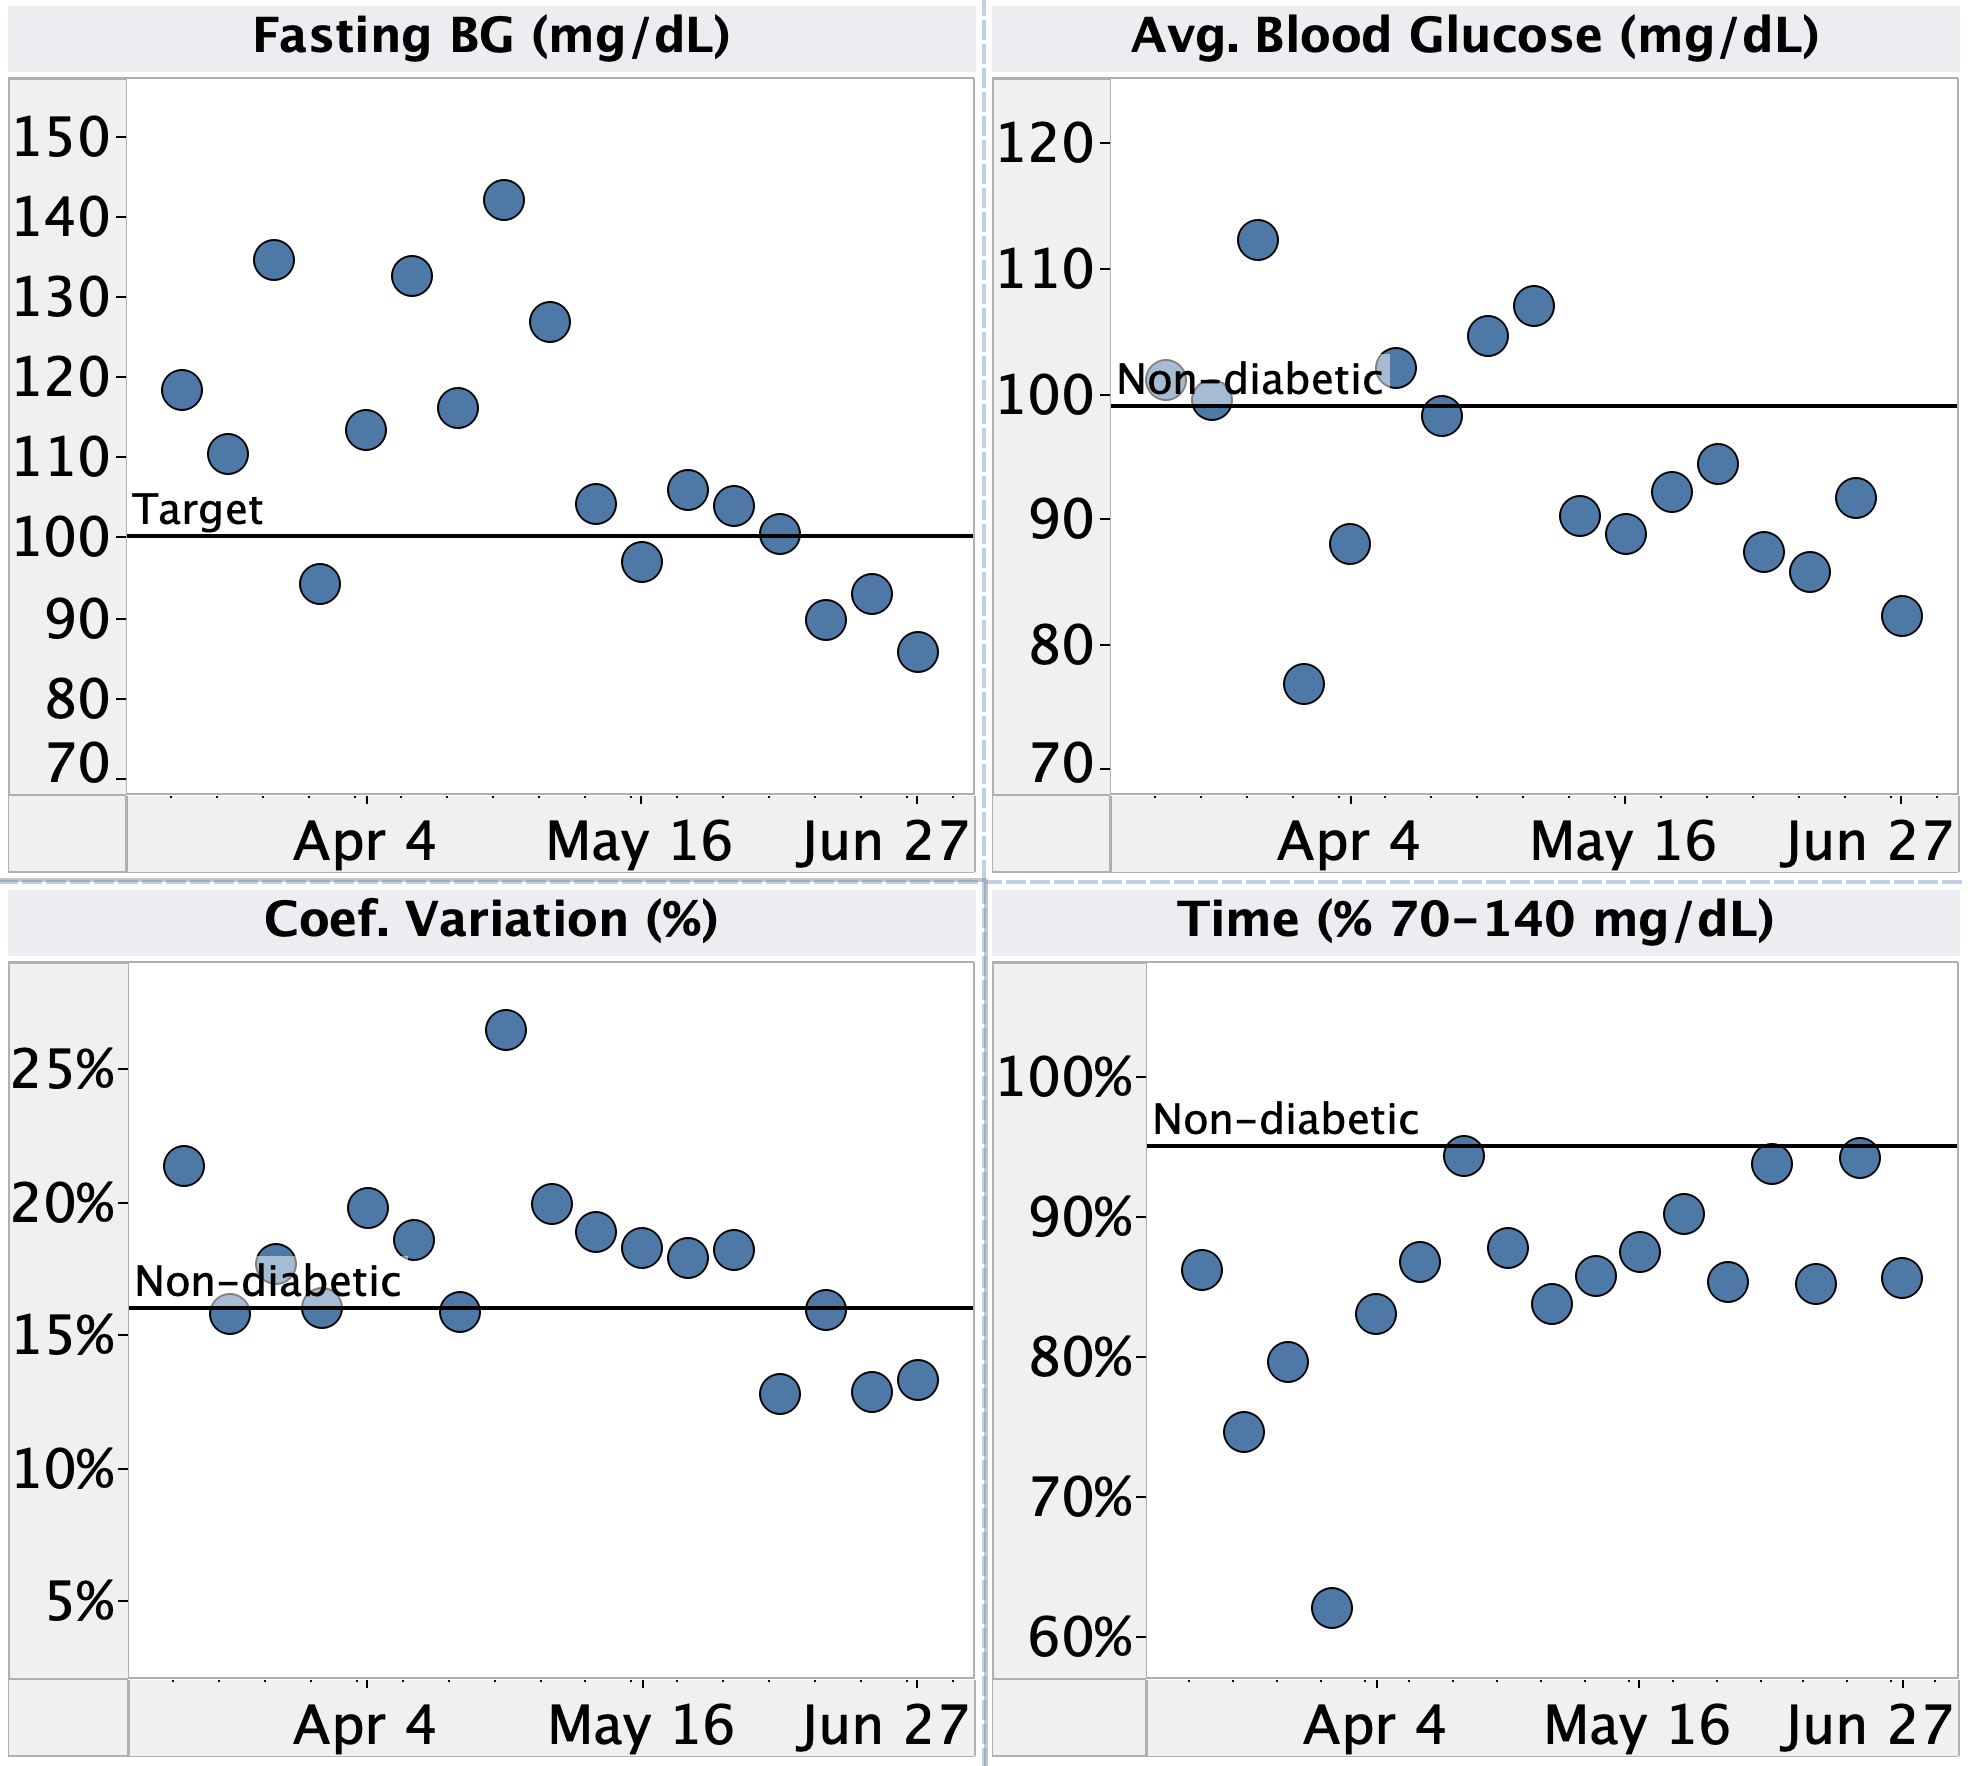
    • Fasting BG spiked up this week, likely due to travel Monday-Wednesday. I ate much later those days (8p vs. normally 5p), which led to a higher fasting BG. 
    • Rest of BG stats were ok, but not great, again likely related to traveling and less controlled meals.
  • Body:
    • Still seeing steady drop in weight and waistline. I’m very happy with my progress here. 
  • Blood:
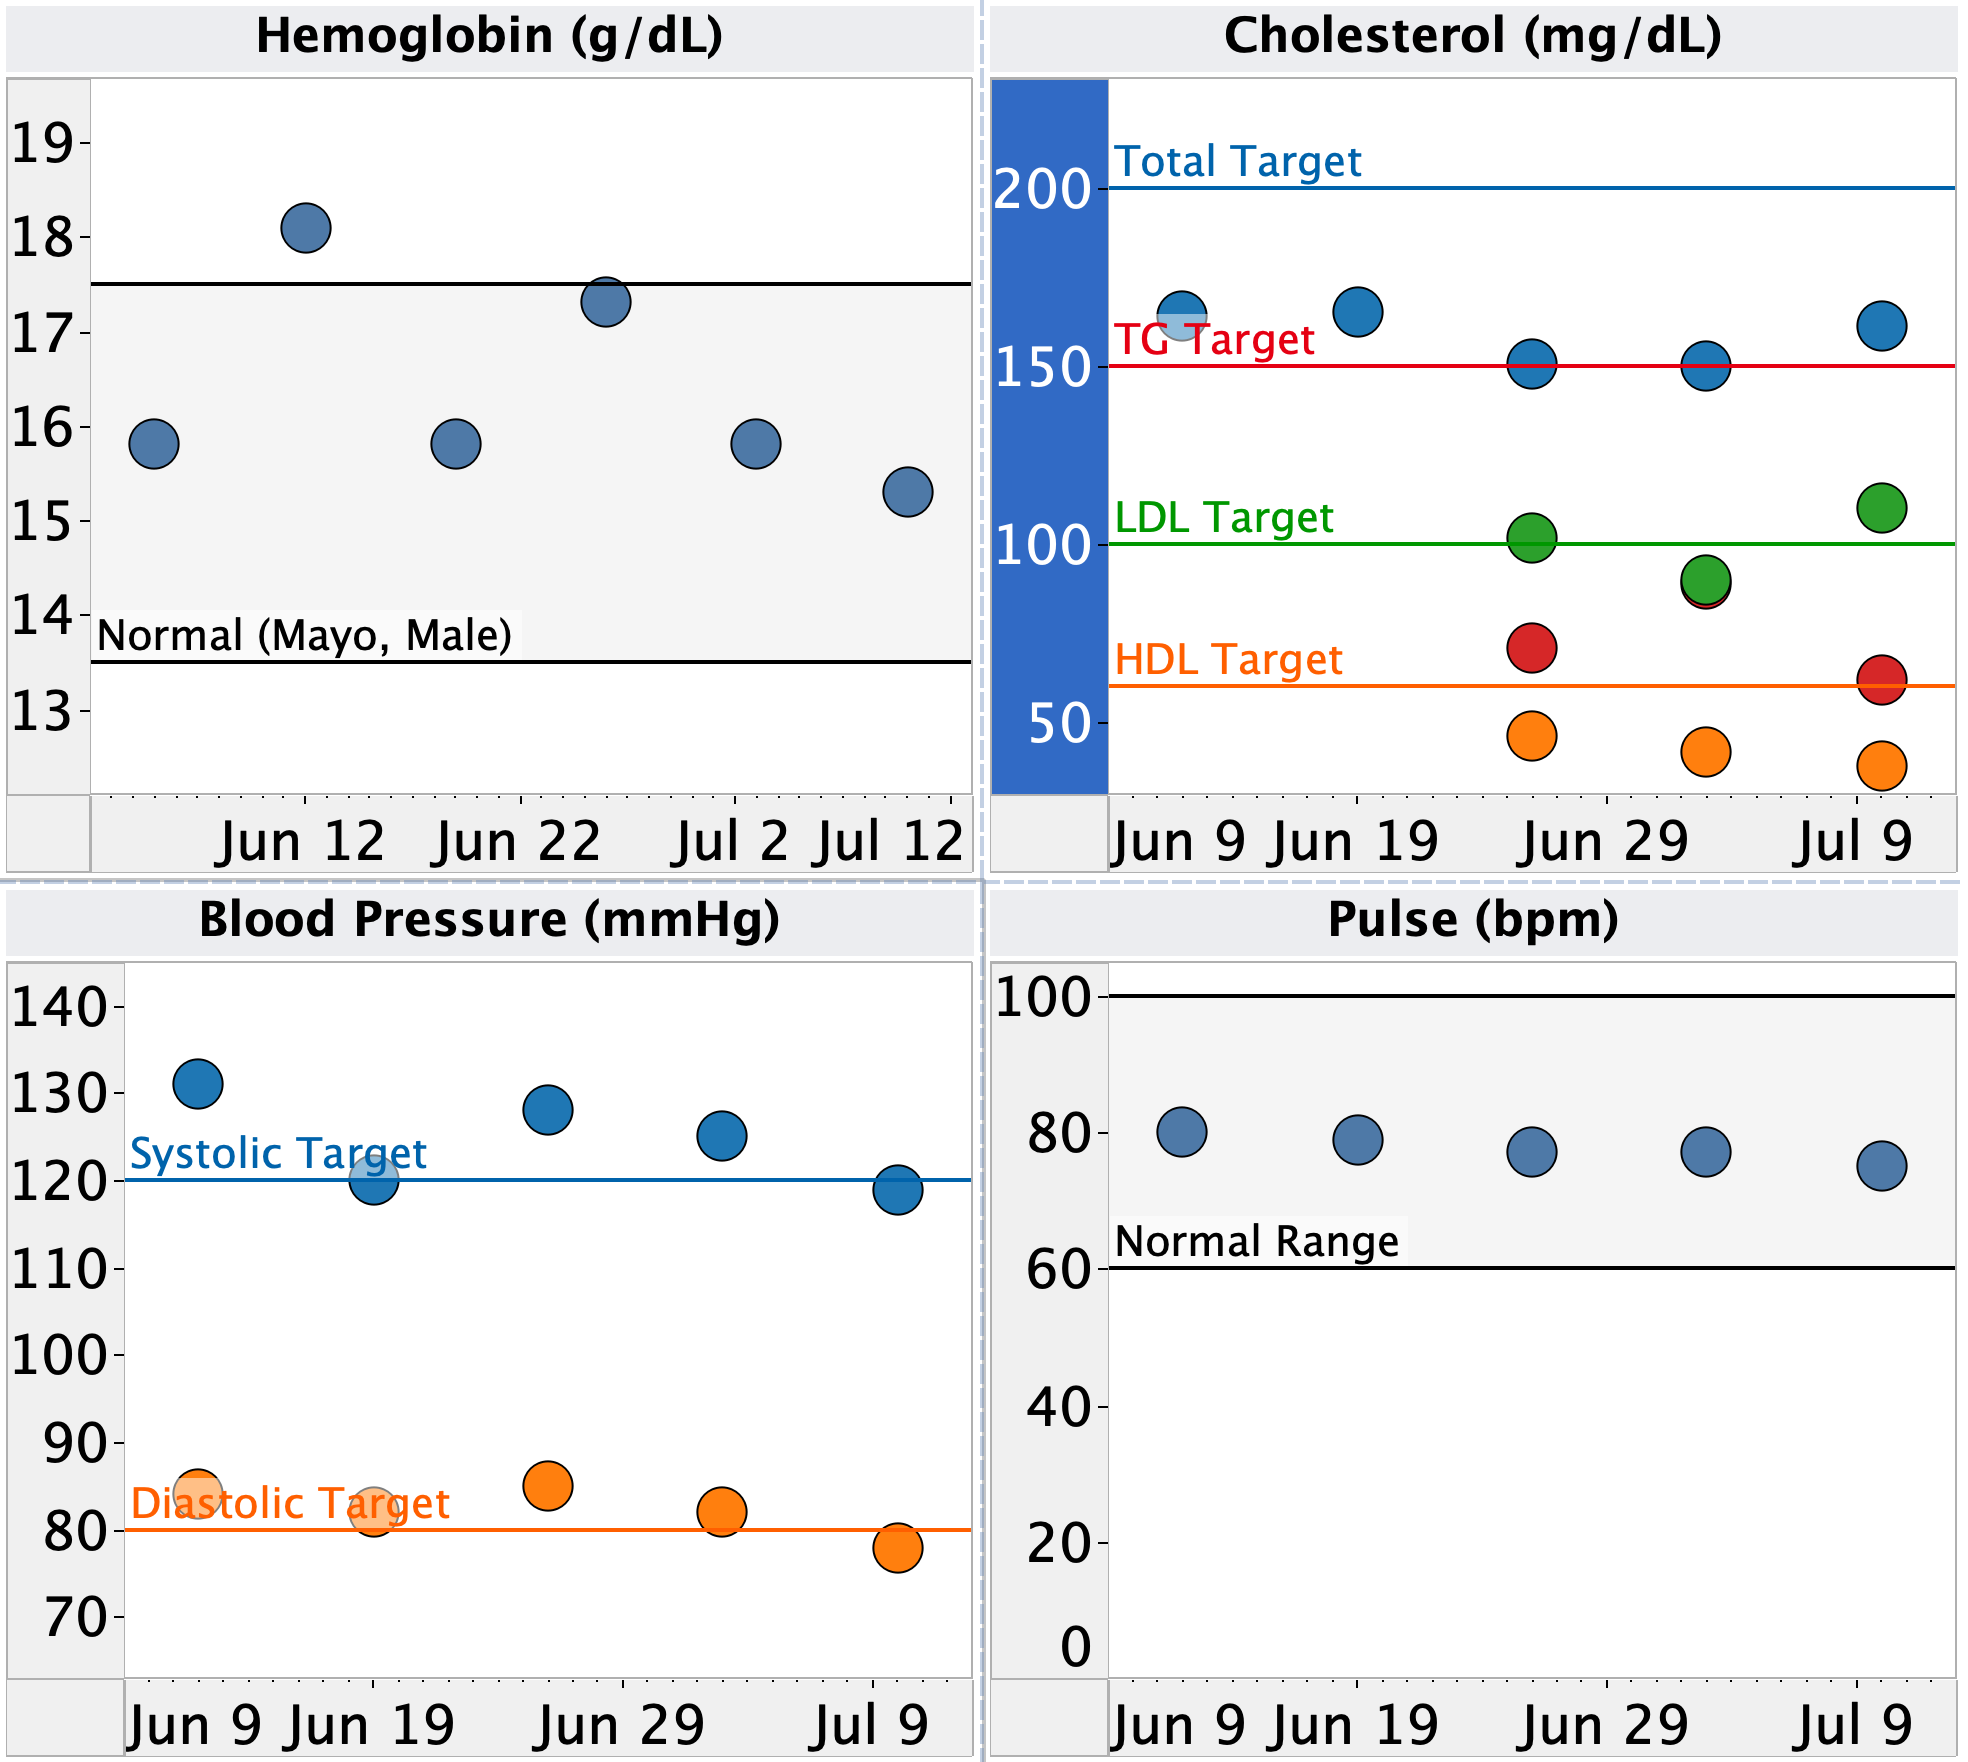
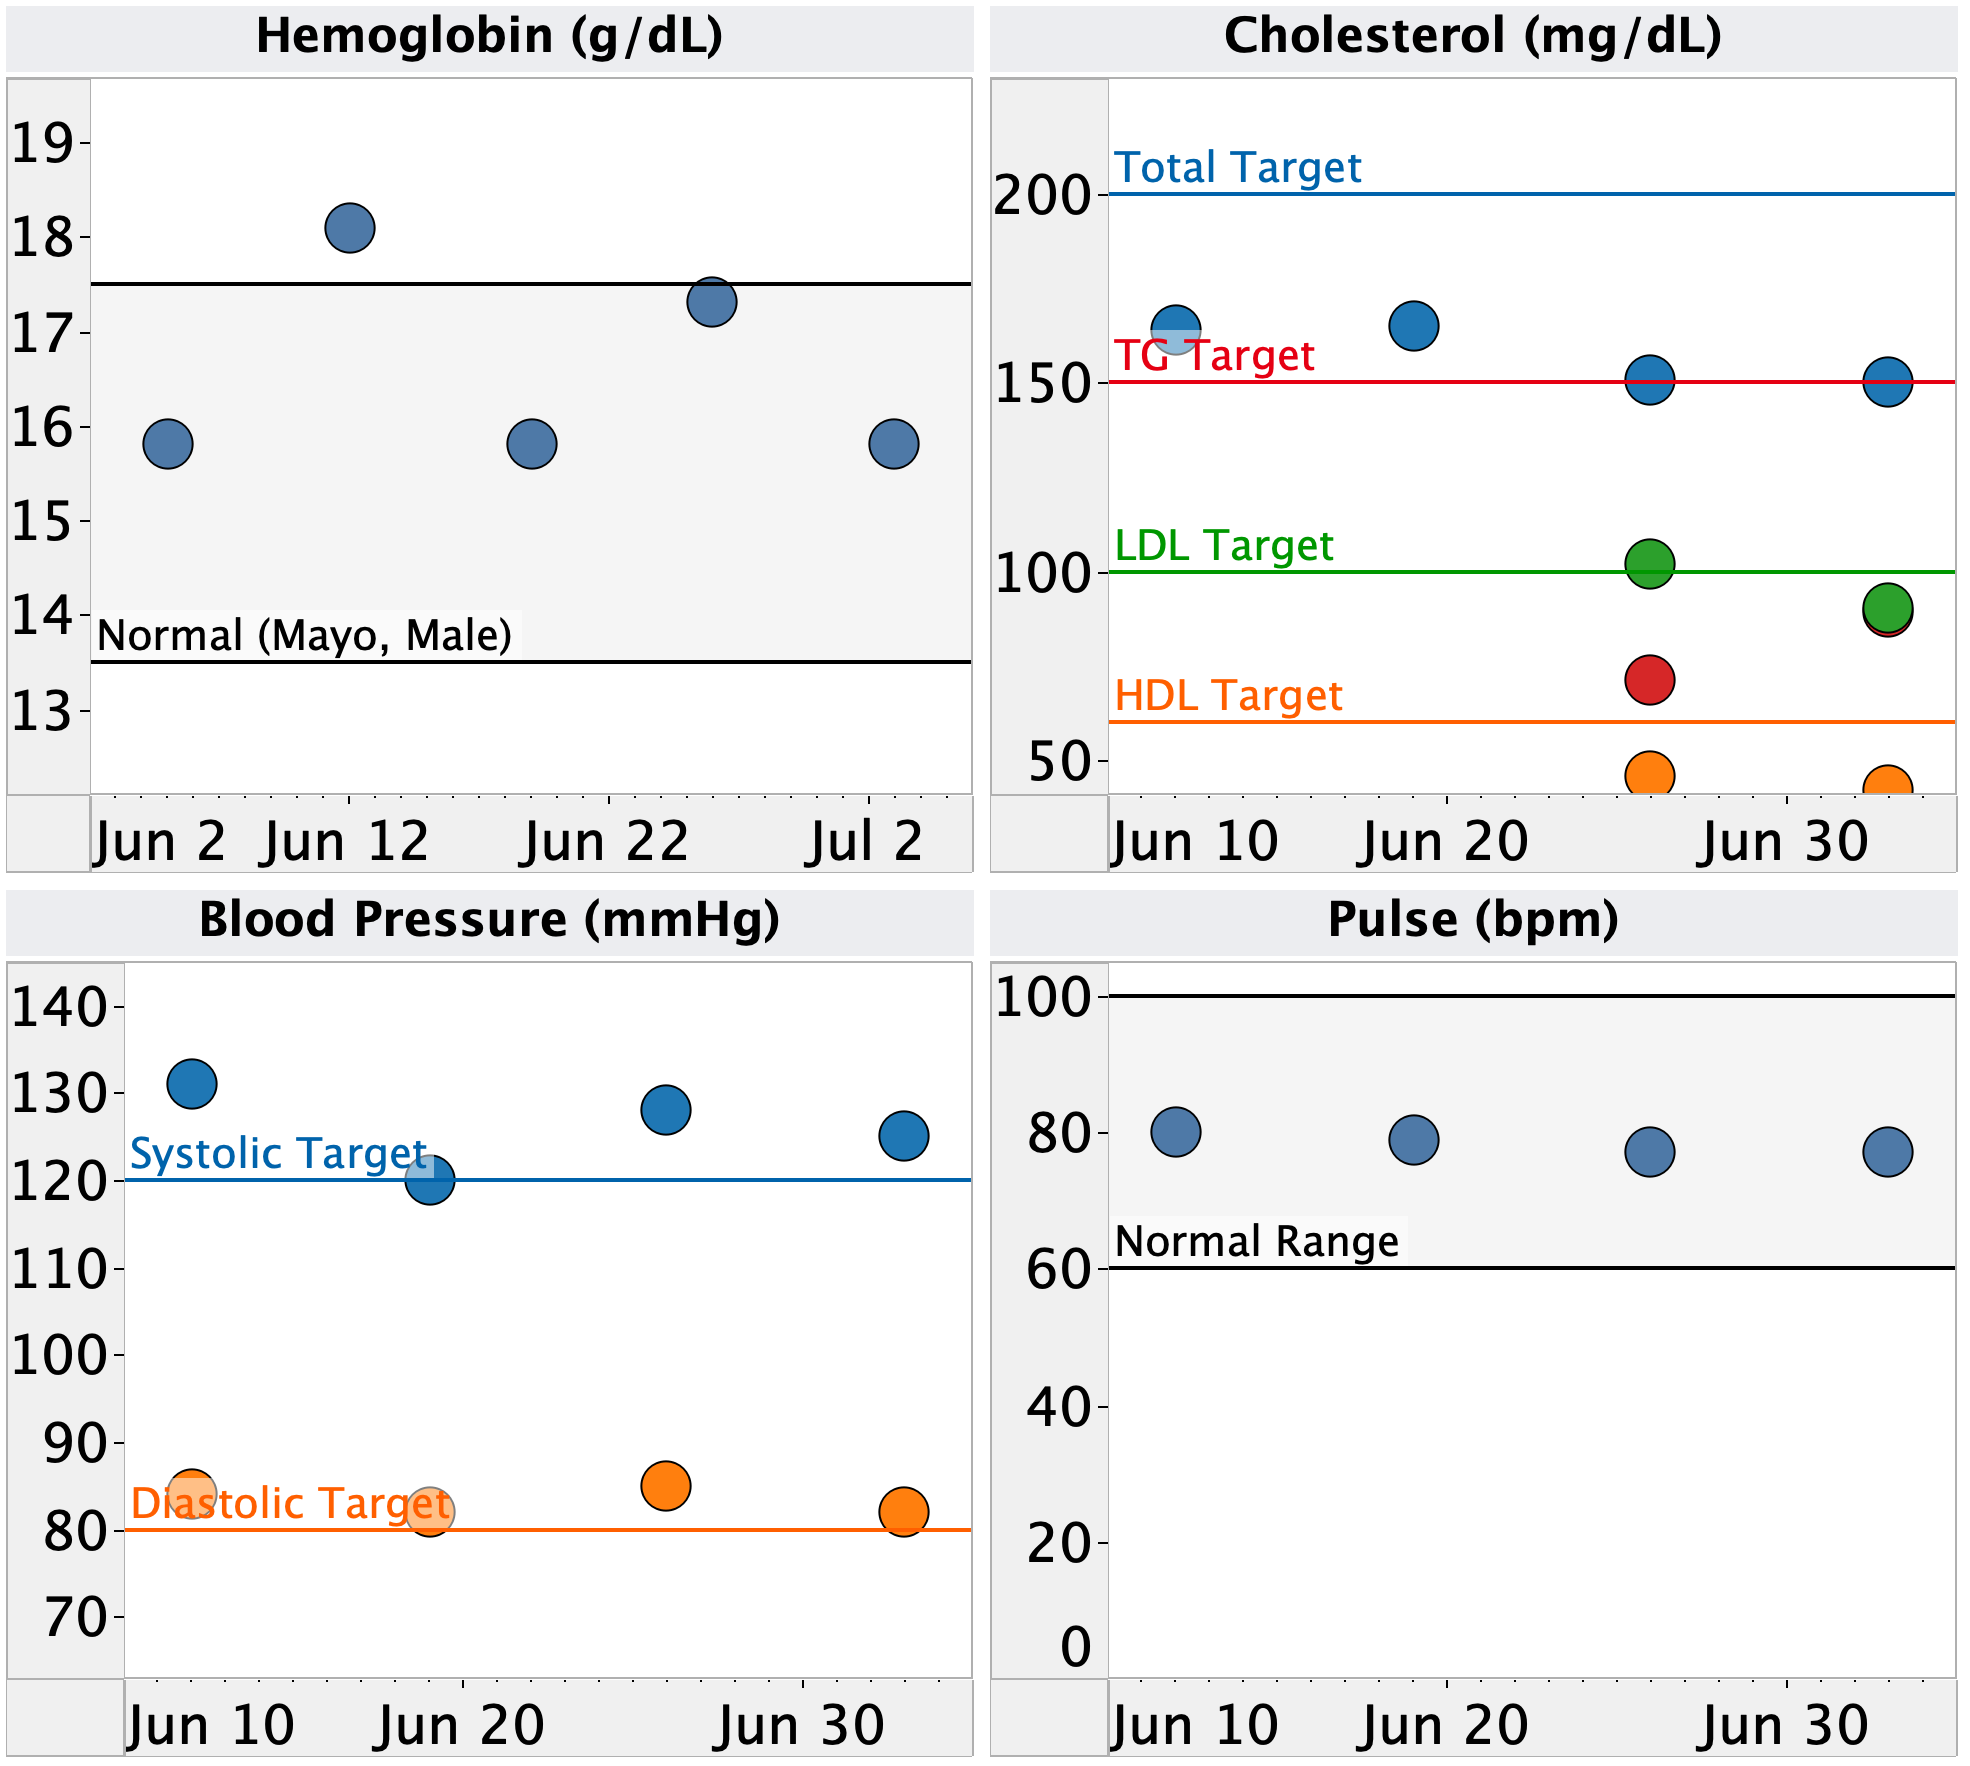
    • Hemoglobin in dead center of normal. Starting to look like those high points were anomalies.
    • Cholesterol (total, LDL, and HDL) looks like it’s holding steady. Numbers are decent, but could be better. I may target this for intervention after my sleep study.
    • Blood pressure seems to be trending down. Will keep an eye on.
  • Urine:
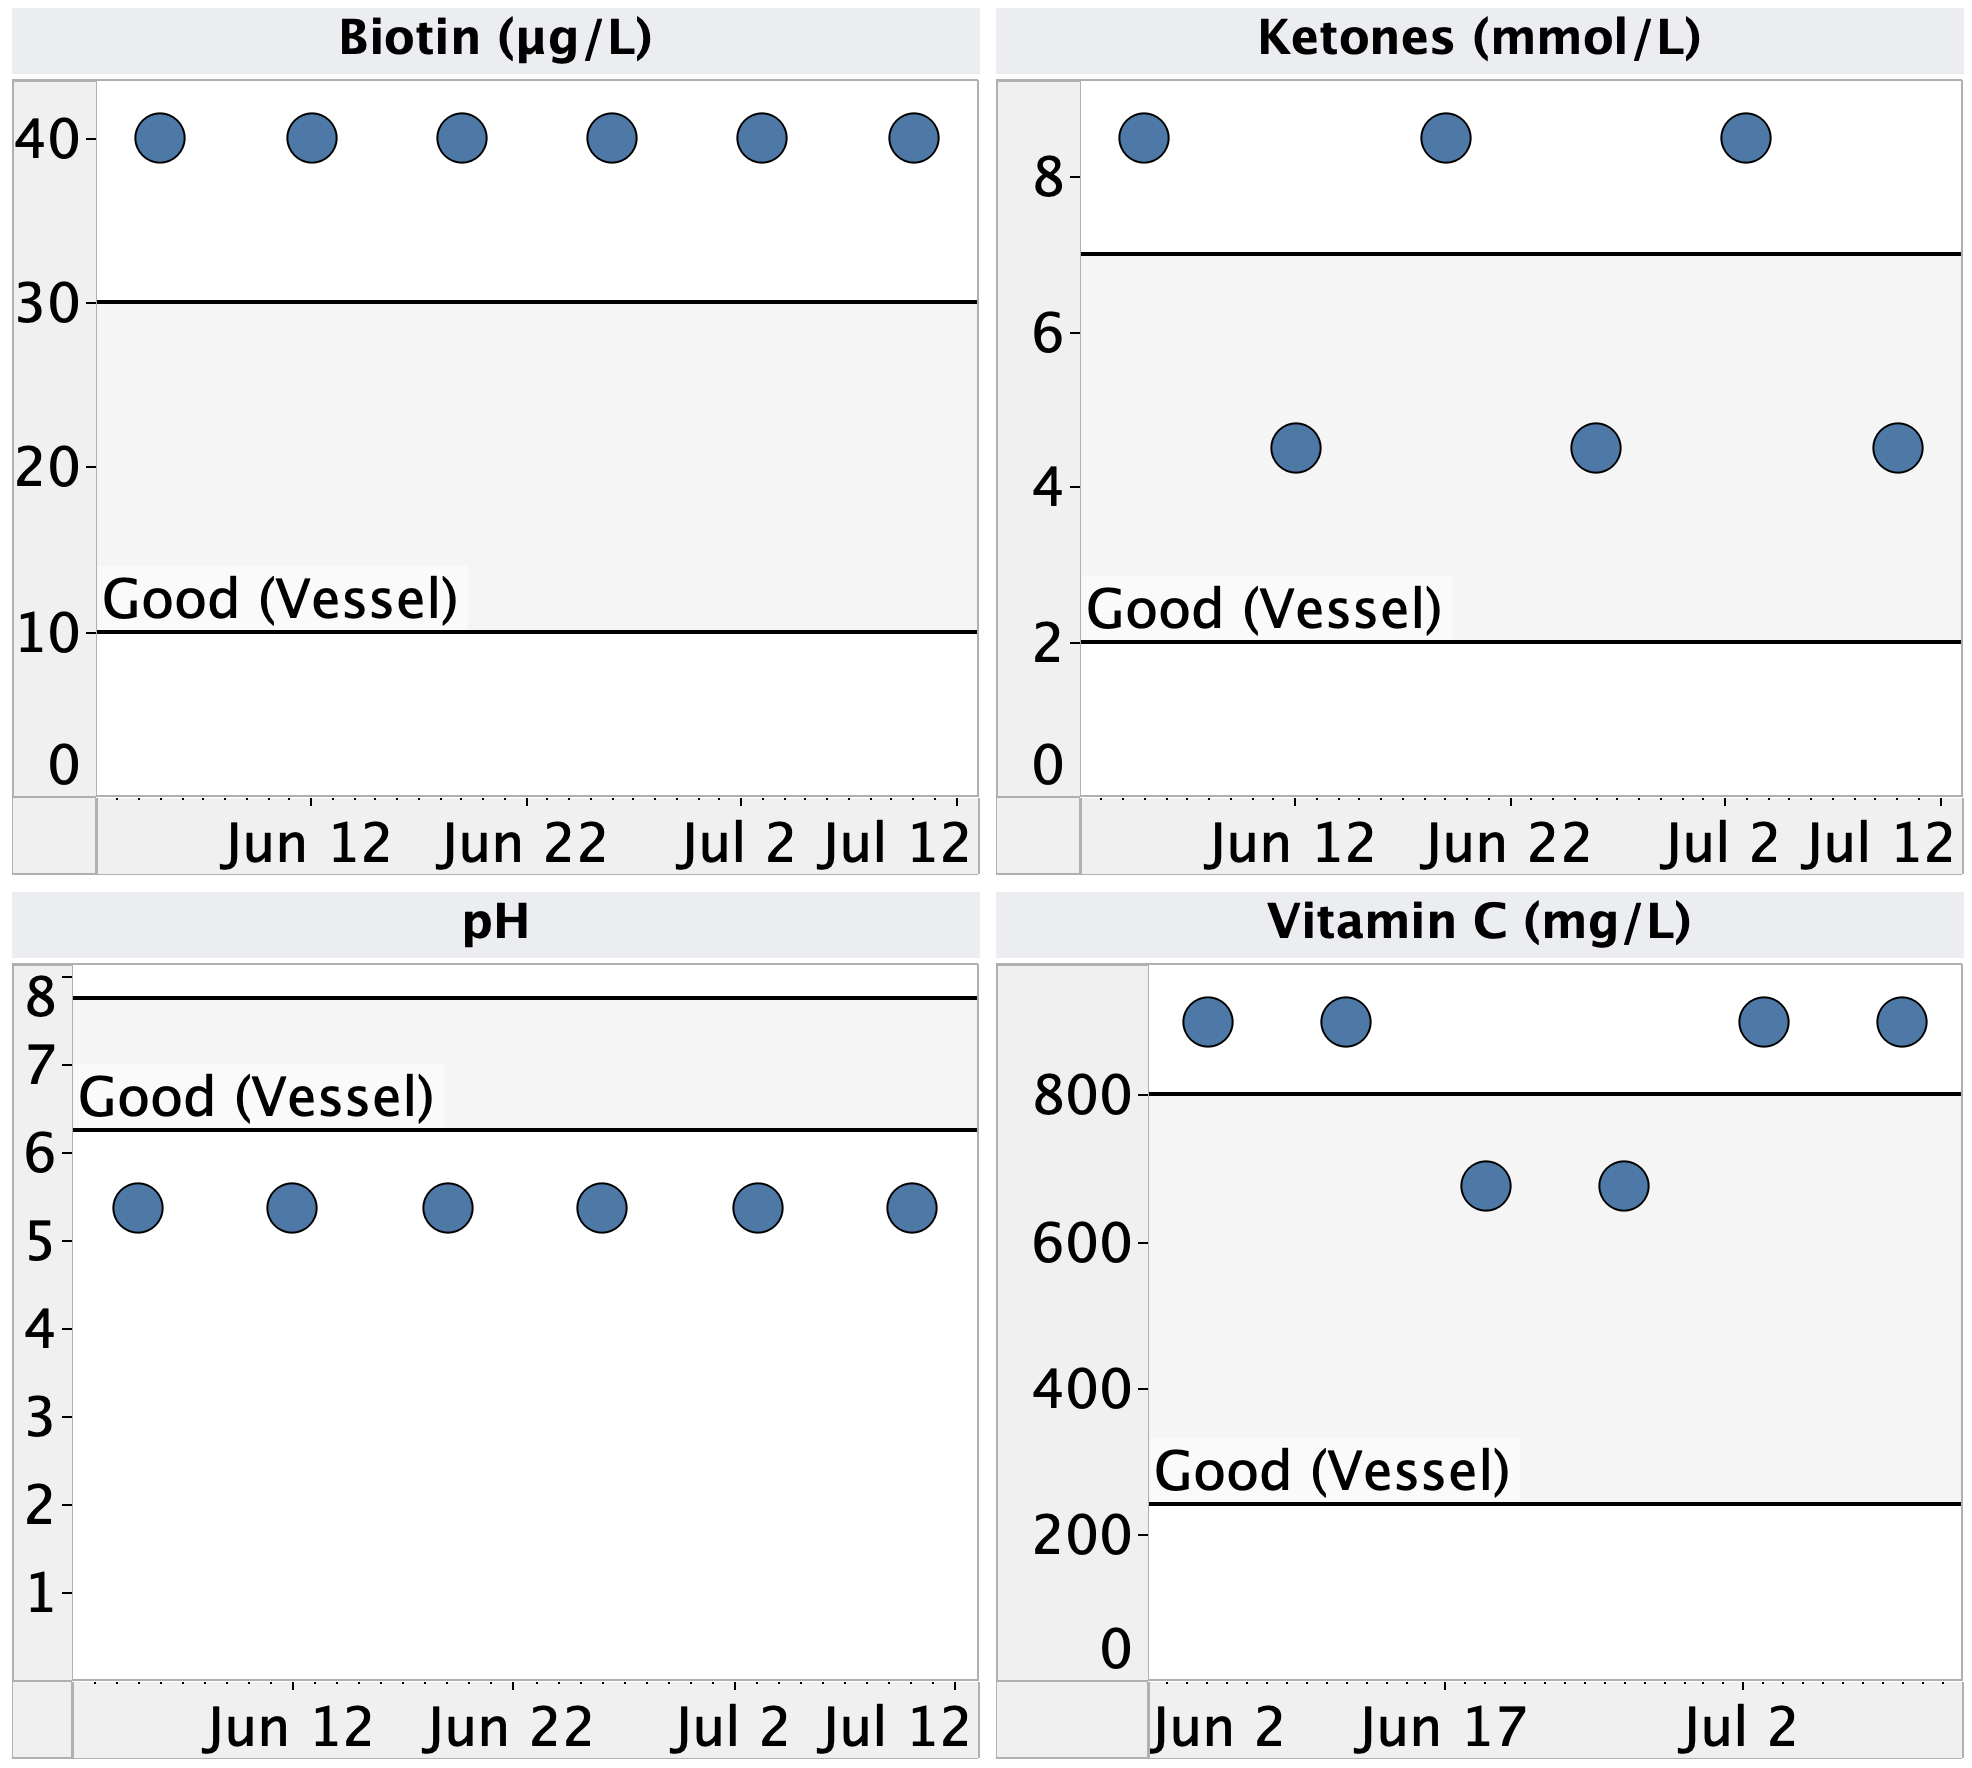
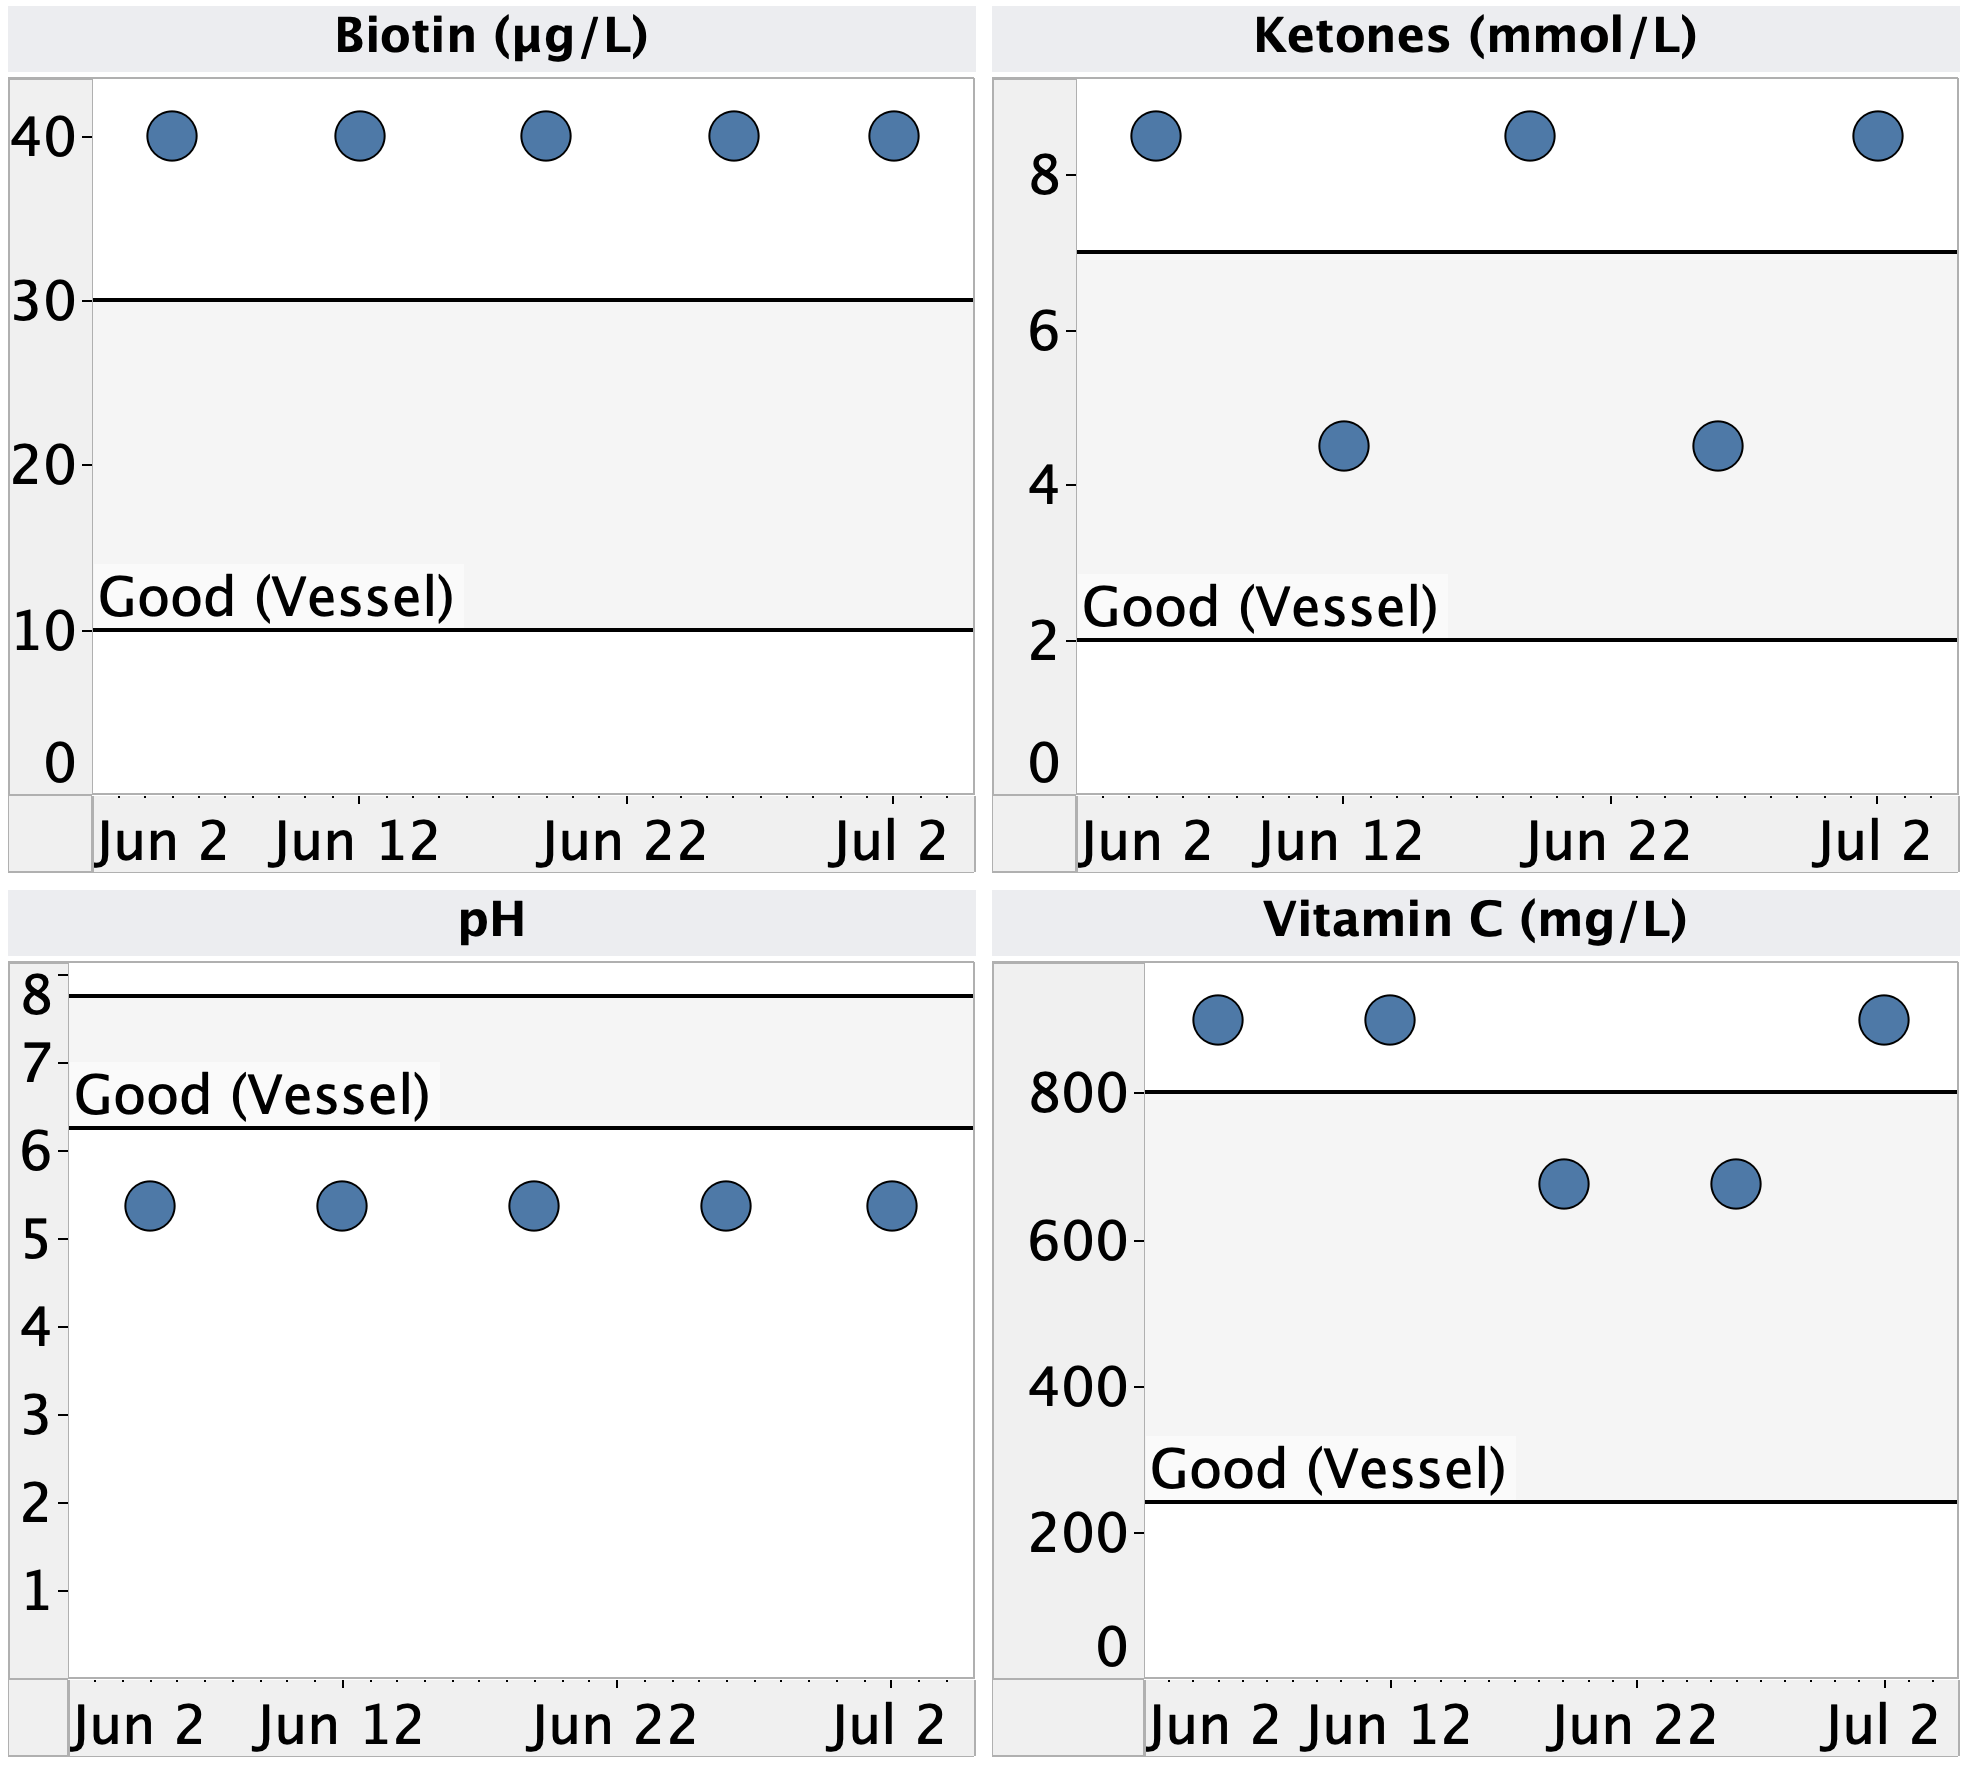
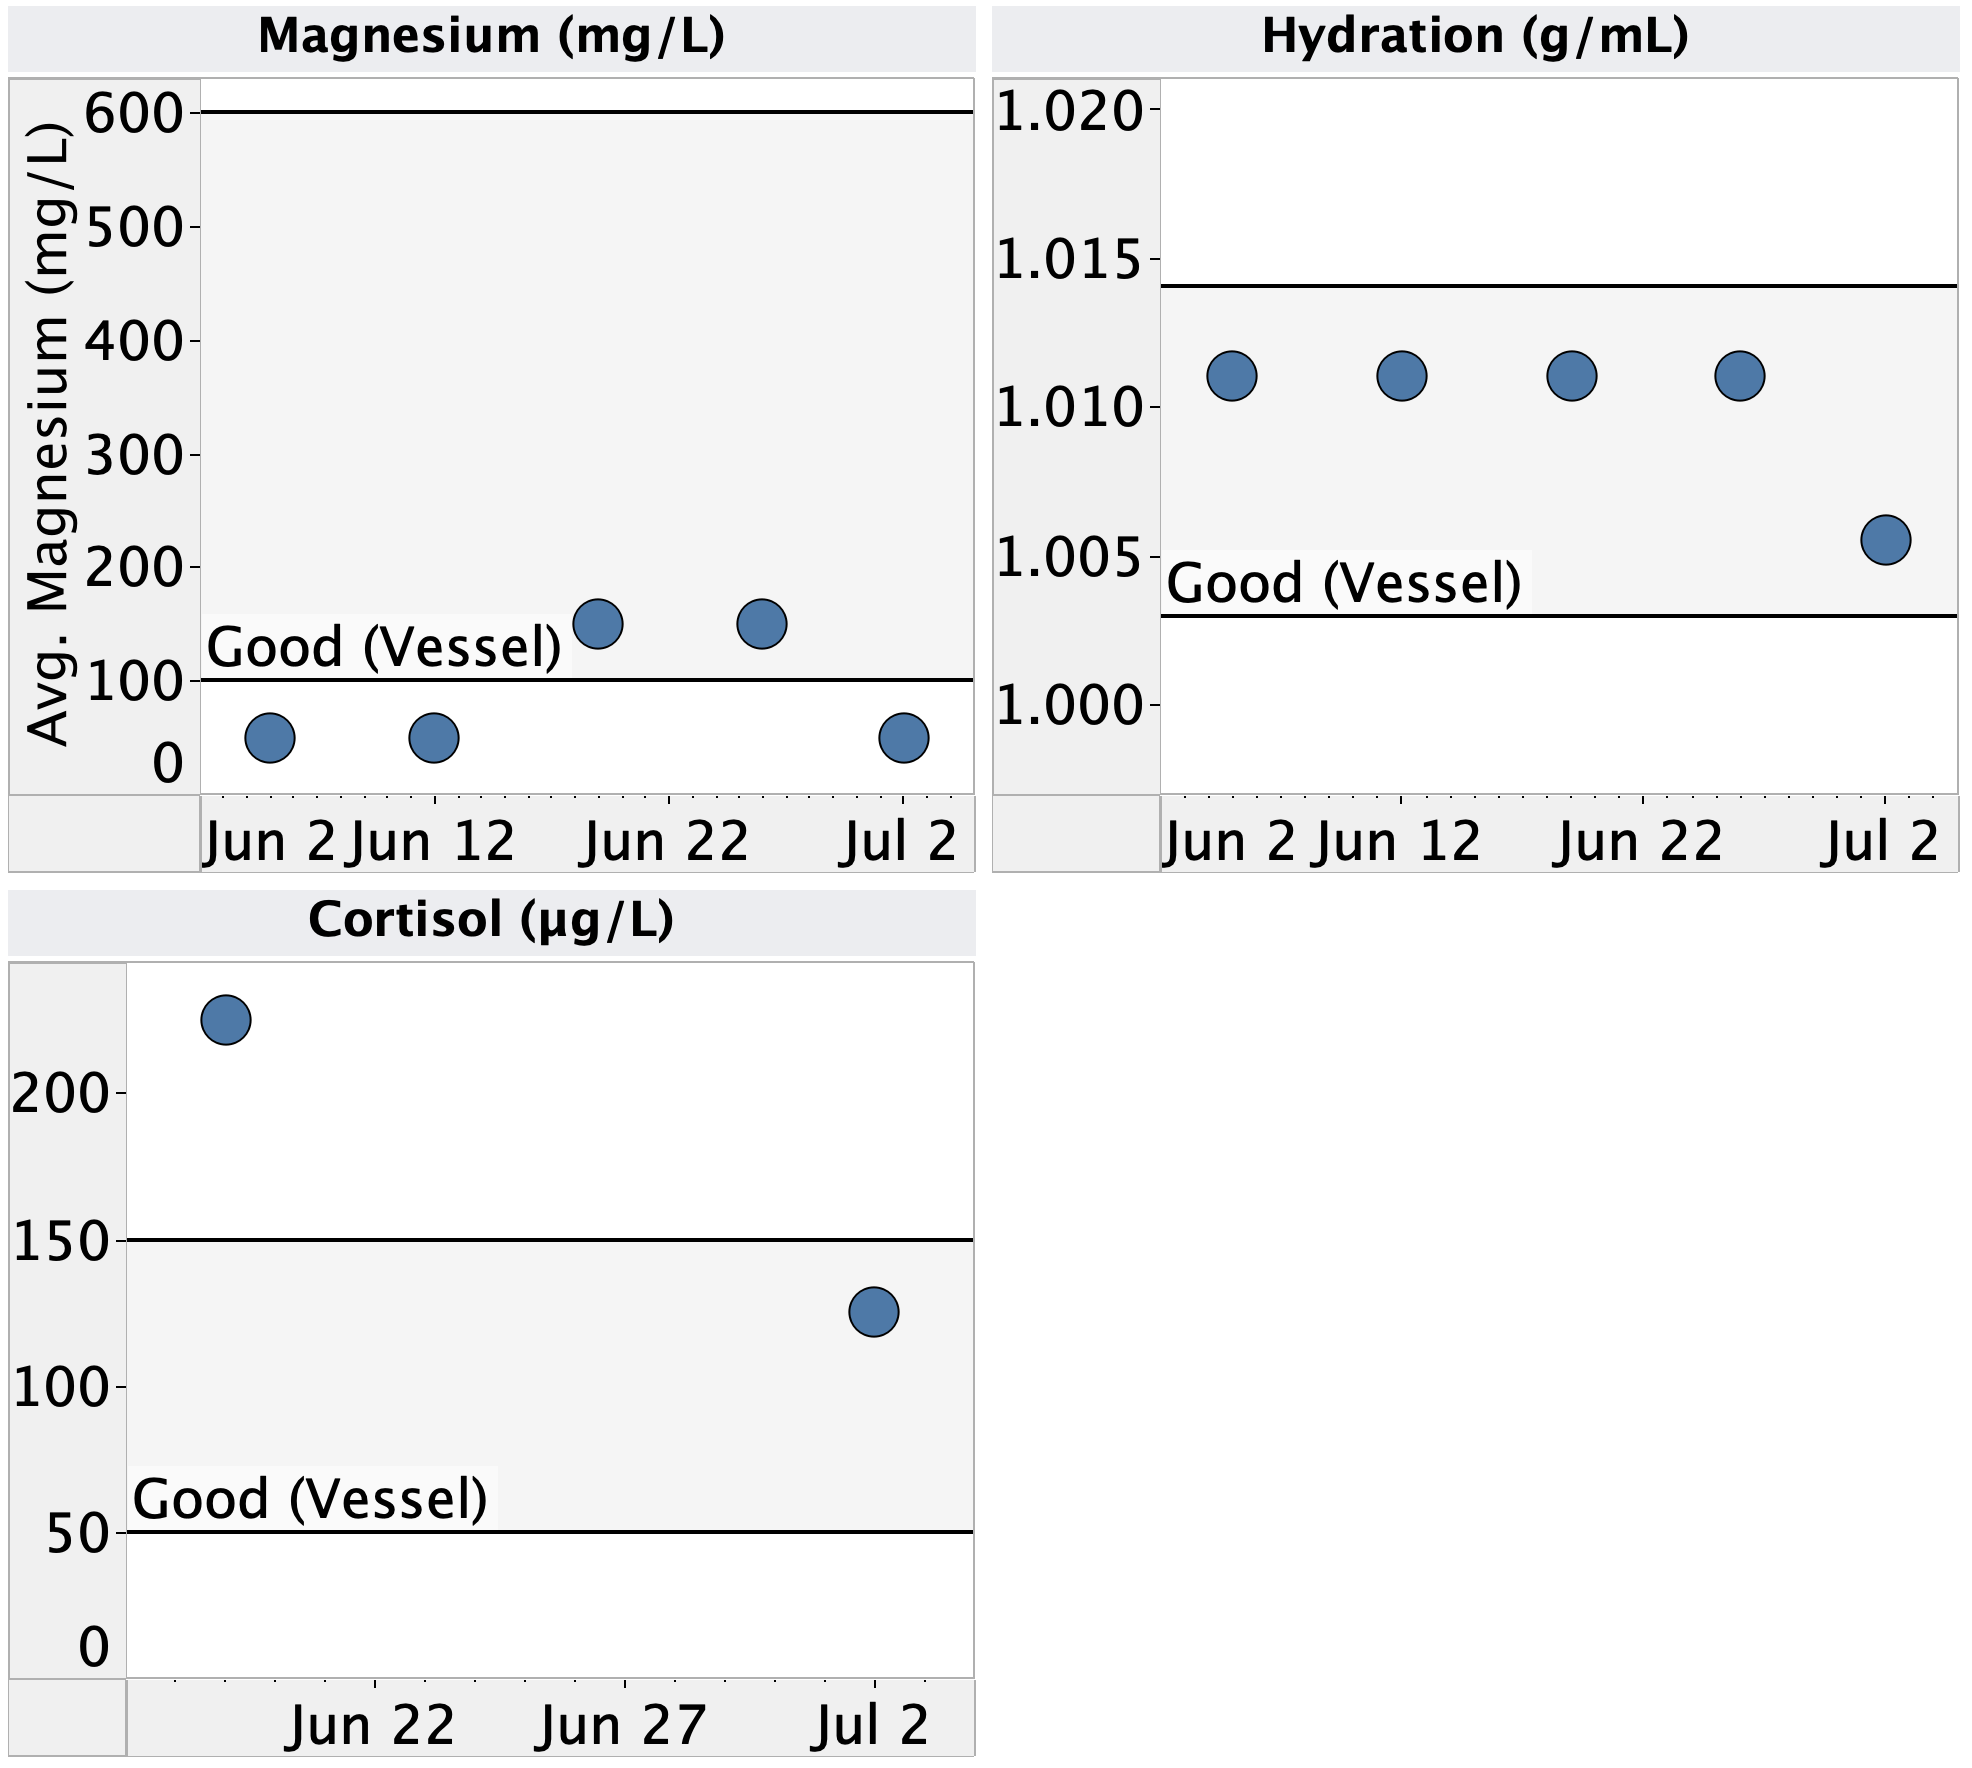
    • Nothing interesting in this data. My values for biotin, pH, & Vitamin C are outside of the “normal” range, but I haven’t been able to find any literature indicating that this is even correlated with medical issues I would be concerned about.
    • In 6 tests, I’ve only gotten a reading on cortisol three times. That measurements seems to be extremely unreliable.
    • All-in-all, I’m not getting much value out of the vessel tests. I’ve finished out the pack I bought and won’t be continuing these stop.

Active & Planned Experiments

  • Comprehensive bloodwork:
    • Goal: Establish baseline for a broad range of biomarkers and check overall health
    • Approach: WellnessFX Premium panel
    • Status: Got the results, need to analyze and write up.
  • Testing methods of sleeping longer:
    • Goal: Determine interventions that will enable me to stay asleep longer
    • Approach: Melatonin?, will ask in several forums to get suggestions
    • Status: posting in forums this week

Data:

Urine

Blood

Body

Sleep

Methods:

Measurements: 

Data Processing & Visualization. Data was visualized using Tableau.

Data: here


– QD


Get new posts by email or rss feed

Weekly Health Statistics: 6/27 – 7/3/21

Get new posts by email or rss feed


For those checking the dates, I’m posting these with a 1-week lag. 

Summary:

What I’m tracking

  • Sleep: 
    • Method: Apple watch + Autosleep app
    • Metrics: total time, heart rate variability, pulse (sleeping vs. waking)
  • Blood glucose:
    • Method: Dexcom G6 CGM
    • Metrics: fasting BG, Avg. BG, coefficient of variation, time 70-140 mg/dL, time <60 mg/dL
  • Body:
  • Other blood:
  • Urine:
    • Method: Vessel
    • Metrics: biotin, ketones, pH, vitamin C, magnesium, hydration, & cortisol

Observations

  • Sleep:
    • With my family back home, my sleep came right back up to normal. I’ll have to tell my wife she’s not allowed to go on trips anymore 🙂
    • I’m feeling much better/less tired during the day now that I’m going to bed at a consistent time. However, over the last week, I noticed I’m waking up earlier and earlier (total change ~30 min.) despite going to bed at the same time. I’d like to test out some interventions to see if I can stay asleep longer.
  • Blood glucose:
    • Fasting BG & average BG continue to improve and CV% is holding steady at ~13% (very good). 
    • TIR is low again, due to spending too much time below 70 mg/dL. I suspect this is due to increased insulin sensitivity from losing weight, so I’m going to try backing off on my insulin doses.
  • Body:
    • Still seeing steady drop in weight and waistline. I’m very happy with my progress here. 
  • Blood:
    • Hemoglobin continues to be on the high end of normal range. Still doesn’t matter.
    • Slight trend down in cholesterol (total, LDL, and HDL). Will keep an eye on.
    • Cardiocheck PA continues to give reliable readings (and matched Quest blood work). 
    • Blood pressure continues to run slightly high. Need to check against the Dr’s at my next appointment
  • Urine:
    • Nothing interesting in this data. My values for biotin, pH, & Vitamin C are outside of the “normal” range, but I haven’t been able to find any literature indicating that this is even correlated with medical issues I would be concerned about.
    • In 5 tests, I’ve only gotten a reading on cortisol twice. That measurements seems to be extremely unreliable.
    • All-in-all, I’m not getting much value out of the vessel tests. I will finish out the pack I bought and then stop.

Active & Planned Experiments

  • Comprehensive bloodwork:
    • Goal: Establish baseline for a broad range of biomarkers and check overall health
    • Approach: WellnessFX Premium panel
    • Status: Got the results, need to analyze and write up.
  • Testing methods of sleeping longer:
    • Goal: Determine interventions that will enable me to stay asleep longer
    • Approach: Melatonin?, will ask in several forums to get suggestions
    • Status: posting in forums this week

Data:

Urine

Blood

Body

Sleep

Methods:

Measurements: 

Data Processing & Visualization. Data was visualized using Tableau.

Data: here


– QD


Get new posts by email or rss feed