Experiment Pre-Registration: Measuring the Effect of Sleep on the Blood Glucose Impact of Meals (Replication of Ilmo Stromberg’s Results)

Ilmo Stromberg just posted a fantastic write-up of 100 days of monitoring his blood glucose using a CGM. He had tons of interesting observations, but the three that stood out for me were:

  1. No correlation (R2=0.03) between average glucose and sleep score (Oura ring, R2=0.003)
  2. Slight correlation (R2=0.09) between last glucose value before sleep and deep sleep (Oura ring)
  3. Strong correlations (R2=0.36, 0.92, & 0.98) between total sleep the previous night and “meal scores” (a measure of the blood glucose impact calculated by the Veri app from the CGM data).

From my own data, I also haven’t seen a correlation between average glucose and time asleep, but I never thought to check impact on just meals to reduce noise in the measurement.

For the correlations with specific meals, Ilmo had a relatively small data set (3 meals, 4 datapoints each), but the effect was consistent and strong.

I’m interested to see whether I can detect the same effect. I eat a very consistent breakfast and relatively consistent lunch, so I should be able to get a statistically robust measurement in a relatively short time.

I’m pre-registering the experiment here for data quality & transparency and to get feedback on the experimental design.

Details

Experiment

  • Breakfast:
    • I will take 4.5u of Novolog (fast acting insulin, duration of 2-4h), wait 30 min., then eat 50g ketochow with 2 tbsp. of butter (websiteBG testing).
    • This is my standard breakfast and insulin dosage and will be used every day.
  • Lunch:
    • I will take 3u of Novolog (fast acting insulin, duration of 2-4h), wait 15 min., then eat 50g ketochow with 2 tbsp. of butter (websiteBG testing).
    • This is my standard lunch and insulin dosage when I’m not doing a food effect experiment. On days when I am doing a food effect experiment or otherwise need to deviate from this meal, I won’t record data.

Measurements

  • Blood glucose will be monitored using a Dexcom G6.
  • Sleep will be measured using the Oura Ring 3
  • For each meal, I will record:
    • Time of insulin injection
    • Amount of insulin injected
    • Time of meal
    • Any additional observations

Analysis

  • I will conduct an analysis after collecting 30 days of data. If the results are inconclusive, I will collect an additional 30 days of data and re-analyze.
  • Peak change in blood glucose and area under the curve will be calculated for the 2h after each meal.
  • Pearson R (with 95% CI) and p-value will be calculated for the following correlations:
    • Peak change in blood glucose vs. time asleep (breakfast & lunch)
    • iAuC vs. time asleep (breakfast & lunch)
    • Average daily glucose vs. time asleep (prev. night)
    • Average daily glucose vs. sleep score (prev. night)

Please let me know if you have any comments or suggestions on the experimental design.

I will start recording data immediately and will report out the results on March 12th


– QD
Experiment Pre-Registration: Testing the Accuracy & Convenience of Innovative/Interesting Blood Glucose Meters

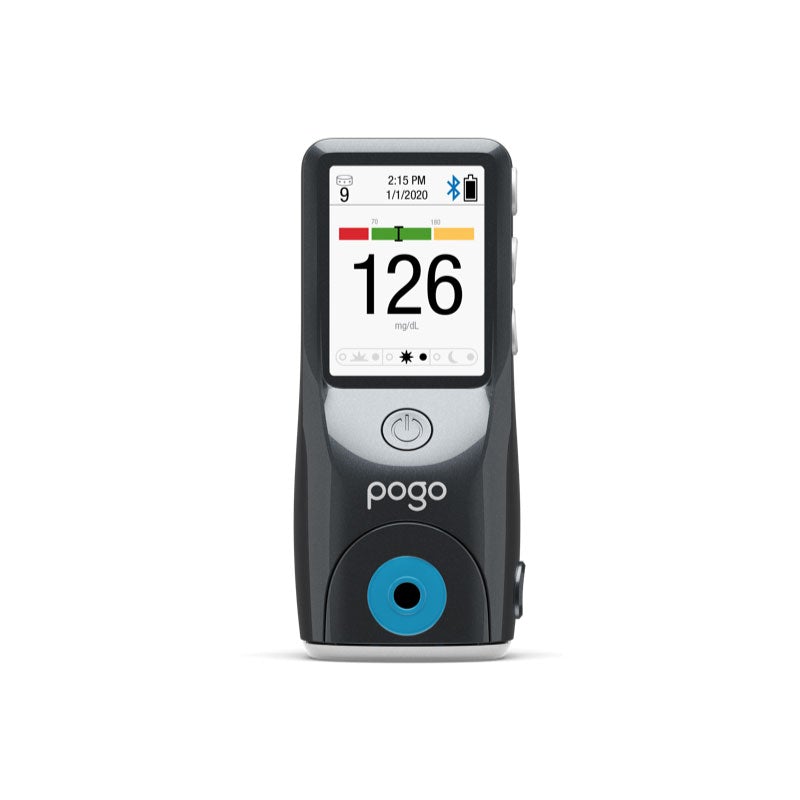
A few weeks ago, I ran across the Pogo “all-in-one” blood glucose meter in this sub. I was intrigued by the concept of a meter that automated lancing, blood draw, and strip changing, so I tried it out. Unfortunately, I found it to be a less accurate and more painful than my trusty FreeStyle Lite meter.

There are a number of other meters I’m interested in trying out, so I decided to expand the study. I’m pre-registering the experiment here for data quality & transparency and to get feedback on the choice of meter and experimental design.

Does anyone have recommendations for interesting blood glucose meters they’d like to see me test?

Details

Meter Selection

To find blood glucose meters to test, I searched Google, Amazon, various diabetes forums, and posted to r/diabetes. I also looked at academic papers testing the accuracy of different meters, the most useful of which was a paper from Russell and co-workers. Based on this, I selected the following meters to test:

  • Control: FreeStyle Freedom Lite
    • This is the meter I’ve been using since I got diabetes ~10 years ago. It ranks 5th on accuracy in the paper from Russell and co-workers and requires very little blood, making it easy and quick to use.
  • Precision: Contour Next & OneTouch Verio Flex
    • These were the two most accurate and precise meters from the paper from Russell and co-workers.
    • The actual OneTouch meter from the paper was the VerioIQ, but that’s no longer available. The Verio Flex is a newer meter from OneTouch, so hopefully it’s as good or better.
  • Low-cost: ReliOn Premier
    • This is Wallmart’s low-cost meter. It didn’t perform well in the paper from Russell and co-workers, but it’s only $18 for 100 strips without insurance, so I’m interested to see how it compares.
  • Innovative Design/Functionality: Dario, Accu-Check Mobile, & Beta-Chek
    • All three of these have the meter, lancets, and strips contained in a single device, making carrying the meter much more convenient.
    • Pogo had the same promise, but was less accurate and more painful, so I’m really interested to see if these work better.
  • Meters that are of interest, but I can’t get: Beurer 50 GL Evo & Glucorx
    • These both look interesting, but are not available where I live. If anyone has a suggestion on how I can get them, I’ll add them to the experiment.

Experiment

  • I will test my blood glucose once per day for 15 days, rotating between three times: pre-lunch, pre-dinner, and before bed.
  • At each time, I will take 3 measurements with each meter and record the results from my Dexcom G6, along with any failed test strips and observations on convenience, pain, and other user experience.
  • This will result in 15 sets of 3 measurements for each meter, for a total of 45 measurements/meter or 315 total blood glucose measurements (more if I get additional meters).

Analysis

  • For each meter I will calculate the pooled standard deviation, bias (vs. Freestyle Freedom Lite), and mean absolute difference (vs. FreeStyle Freedom Lite).
  • All values will be reported with 95% confidence intervals & data will be visualized using Tableau.

Please let me know if you have any comments or suggestions on the choice of meters or experimental design.

The last meter should be arriving by February 13th, so I will report out the results on March 5th.


– QD

Testing the Pogo Blood Glucose Meter: Less Precise, More Painful, and Slower than the FreeStyle Lite

A few weeks ago I saw an article about an interesting new blood glucose meter, the Pogo Automatic Blood Glucose Meter. According to Pogo’s website, the device:

  • Contains the meter, lancets, and strips in a single, compact device
  • Automates changing of lancets and test strips
  • Automates pricking your finger, drawing of blood, and transferring the blood to the test strip
  • Uses less blood than traditional meters (0.25 μL)
  • Meets FDA accuracy requirements (±15% vs. reference meter)

Carrying around a bag with my meter, lancing device, extra lancets, and strips is mildly annoying, so the Pogo sounded like it could be a nice upgrade. To see whether the Pogo was a good as claimed, I bought one and tested it vs. my current meter (FreeStyle Lite) and CGM (Dexcom G6).


Summary

  • I tested 14 sets of 3 measurements each with the Pogo and FreeStyle Lite (98 total)
  • Good
    • The Pogo is very easy to use and could be a big improvement for someone with poor manual dexterity
  • Bad
    • Less reliable: 7 out of 49 failed measurements (14%) vs. 0 for the FreeStyle Lite
    • Less precise: standard deviation of 7 vs. 2.5 mg/dL for the FreeStyle Lite
    • Hurts more: both during lancing & caused sore fingers afterwards
    • Prolonged bleeding: often bled for >1 min. after lancing
    • Slow: >10s to take a measurement vs. <5s for the FreeStyle Lite

Overall, while having everything in a single device is convenient, it’s not even close to worth the poor reliability, reduced precision, and increased pain & bleeding.

Conclusion: I’ll be sticking with my FreeStyle Lite.

This is the first “product review” I’ve done and I’m curious if it’s interesting/useful for people. If you have diabetes or other quantified self products you’d like me to test, please let me know in the comments.


Details

Experiment

  • Over the course of 9 days, I did 14 sets blood glucose measurements and random times.
  • Each time, I took 3 measurements each with the Pogo and FreeStyle Lite, and recorded the result from my Dexcom G6.
  • I also recorded any failed test strips or other observations.
  • For each meter, I calculated the difference pooled standard deviation, bias (vs. Lite), and mean absolute difference (vs. Lite).

Raw data & analysis: link


General Observations

Good

  • It took me a couple tries to get the hang of the technique, but the Pogo is very easy to use. You just turn it on, press your finger on the lancing area, and the Pogo handles the rest.
  • The 10 strip/lancet cartridge is easily inserted into the device, no finesse required.
  • If you have poor manual dexterity, the fact that everything is automated might be a big advantage.

Bad

  • The Pogo is much slower than a normal meter. It takes a few seconds to turn on and waits a few seconds each before lancing and collecting blood. Overall, it takes >10 seconds to get a reading on the Pogo vs. <5 seconds on my FreeStyle Lite. Not terrible, but very noticeable.
  • Lancing hurts a lot more than my normal meter. This seems to be due to a combination of the fact that I can’t control the lance depth and that I’m not in control of when the lancing occurs, which is psychologically more difficult for me.
  • My fingers were often sore where I used the Pogo. I never had any soreness where I used the Freestyle Lite
  • The Pogo was less reliable in drawing blood. In 6 out of 42 tests (14%), the Pogo asked me to “milk” my finger for more blood.
  • Wounds from the Pogo often bled for much longer than my normal lancing device (sometimes >1 min). I had to be careful not to touch anything for a few minutes after testing to avoid getting blood on things.

Precision

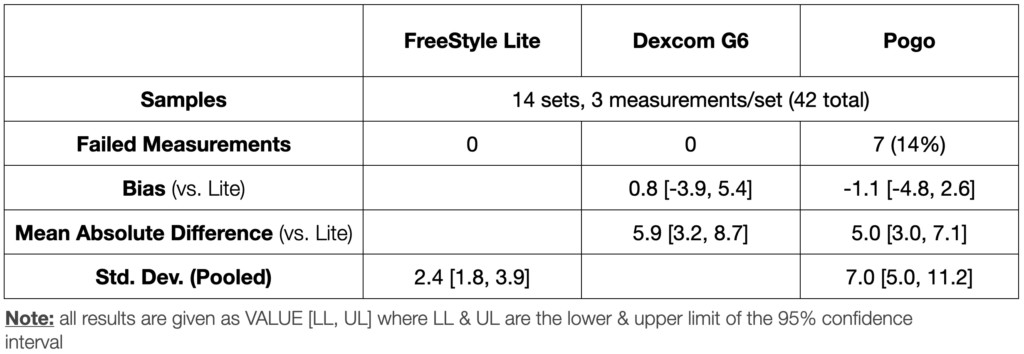
Summary statistics are showing in the table above. The Pogo was:

  • Well calibrated: small and not statistically significant bias vs. the FreeStyle Lite
  • Less reliable: 14% failed tests vs. 0 for the Freestyle Lite
  • Less precise: standard deviation of 7.0 [5.0, 11.2] vs. 2.4 [1.8, 3.9] for the FreeStyle Lite

Importantly, the Pogo showed about the same mean absolute difference as the Dexcom G6, indicating that it wouldn’t add much value as a secondary check of my CGM, which is the main reason I carry a fingerstick meter.


Conclusions

See summary above.


– QD


Get new posts by email or rss feed

Weekly Update & Health Statistics: 12/12/21

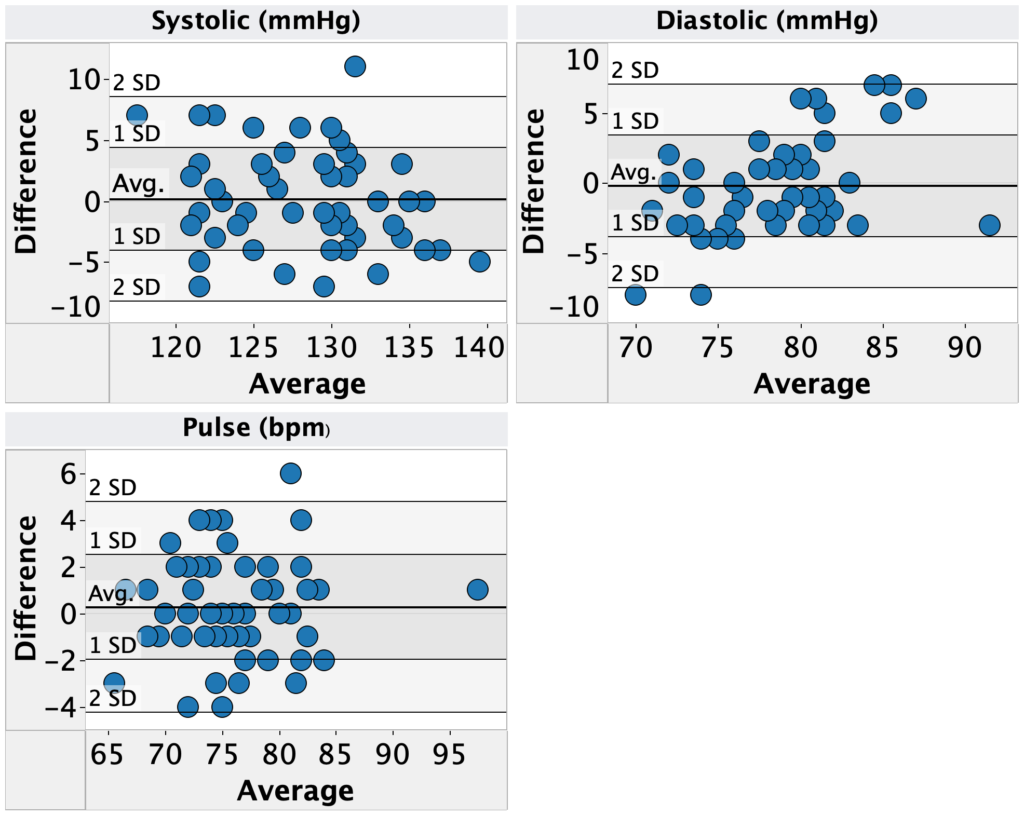
This week, I posted the first experiments from my attempt to reduce my blood pressure. I started by measuring the repeatability (within-instrument variation) and reproducibility (between instrument variation) of my Omron Evolve blood pressure monitor. Unfortunately, the standard deviation was high compared to my target reduction (~3 vs. 10 mmHg), meaning that I’ll need to measure multiple times per observation in order to get sufficient precision.

Lesson for future experiments: I should have measured the repeatability & reproducibility before starting any other experiments. I finished up the deep breathing study before I got these results, and from a quick look at the data, the error bars are too large to draw a conclusion and I’ll need to repeat it. Lesson learned, always run a power calculation first…

Experiments this week:

  • Whole foods: none (traveling)
  • Blood pressure:
    • Completed the deep breathing study, started repeat with 5 measurements/observation
    • Analysis of repeatability testing

Next week:

  • Food effect:
    • continued testing of whole foods
  • Blood pressure:
    • Post initial deep breathing study & continue the repeat.
    • Analysis of historical data.


– QD


Active & Planned Experiments

Let me know in the comments if there’s any other experiments you’d like to see.


– QD


Observations & Data

Continue reading “Weekly Update & Health Statistics: 12/12/21”

Reducing Blood Pressure without Medication Phase 0: Measurement Repeatability & Reproducibility

Get new posts by email or rss feed


For my studies to determine interventions to reduce my blood pressure, the main measurement device I’ll be using will be an Omron Evolve blood pressure monitor. In order to understand the measurements I make, I’m going to need to know the repeatability and reproducibility of the device as well as any systematic biases in the measurements. Notably, some people see blood pressure readings drop with repeat measurements (see comment from Gary Wolf here) and I need to know the magnitude of the effect for any paired sample testing over short time periods.

To measure the repeatability and reproducibility of my Omron Evolve blood pressure meters, I tested (details in below):

  • Repeatability: 19 sets of 5 measurements on the same meter
  • Reproducibility: 56 paired measurements on two different meters (one immediately following the other)

Here’s what I found.

Summary

  • Experiments:
    • Repeatability: 19 sets of 5 measurements on the same meter
    • Reproducibility: 56 paired measurements on two different meters (one immediately following the other)
  • Results:
    • Within meter standard deviation was ~3 mmHg, which is high compared to my target reduction of 10 mmHg.
    • I see a drop in blood pressure with repeat readings, but it’s relatively small (~0.5-1 mmHg/measurement over 5 measurements), and safe to ignore.
    • There’s no detectable difference between my two meters. Since the older one has been used for ~4 months, that indicates that there’s likely no change in the meter over time.
  • Conclusions:
    • Given the high variance vs. my target change in blood pressure, going forward I will take sets of 5 measurements for every observation.
    • This gives an estimated 95% CI of 2.6 mmHg systolic. Still higher than I’d like, but it should allow me to identify reasonable effect sizes (I’ll, of course, need to do power calculations for each planned experiment).

Details

Purpose

  • To determine the repeatability & reproducibility of blood pressure measurements using my Omron Evolve blood pressure meters.
  • To quantify the drop in blood pressure with repeat measurements at the same sitting.

Background

See previous post.


Results & Discussion

Within-meter Repeatability

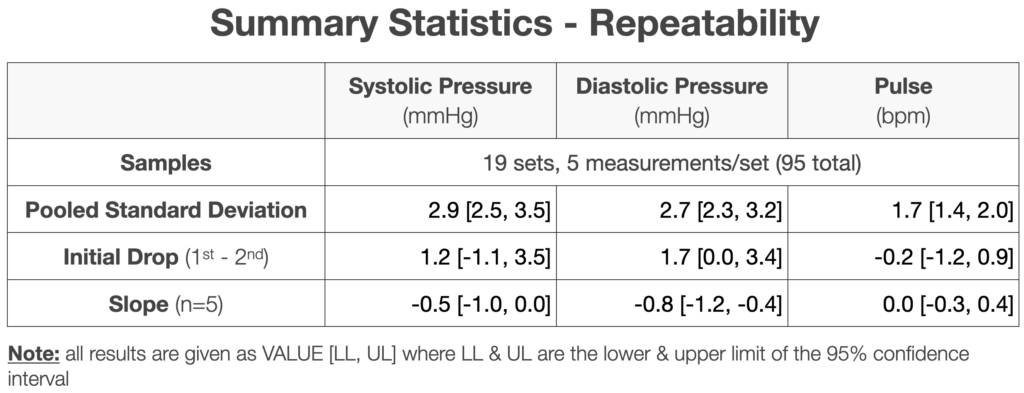
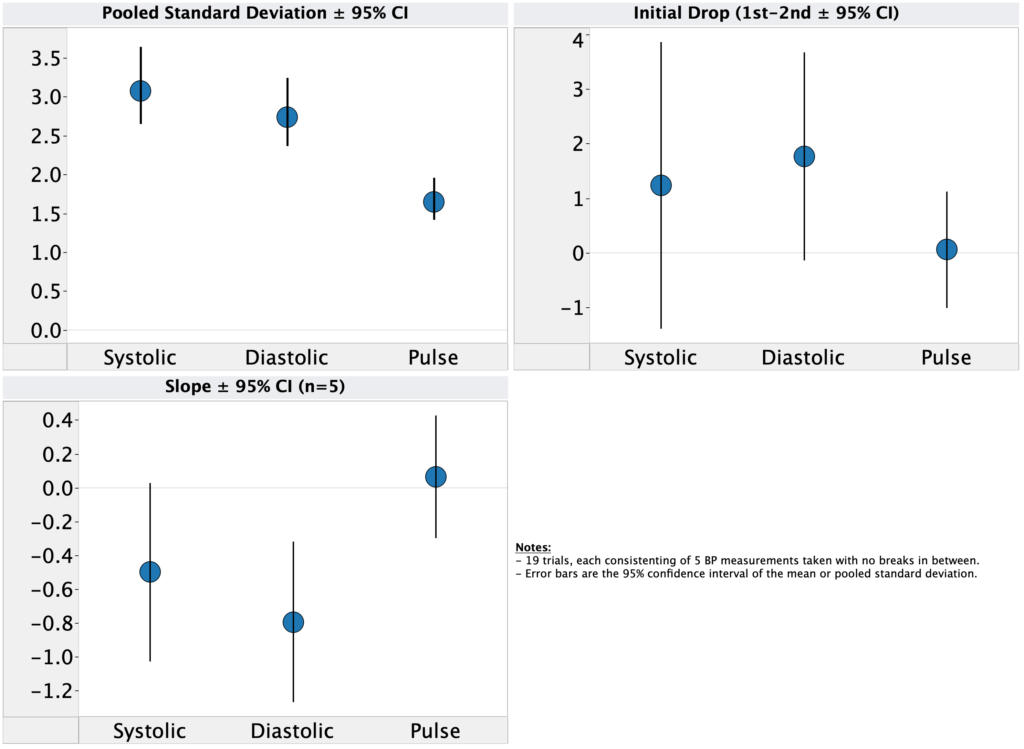
First, let’s take a look at the within meter precision. The pooled standard deviation over 19 sets of 5 measurements was 2.5-3.5 mmHg (95% CI) for systolic and a bit lower for diastolic. This means that for a single-point measurement, I’d have a 95% confidence interval of ~6 mmHg, larger than most effect sizes seen for BP interventions and half the reduction I need to get to normal blood pressure.

To quantify the drop in blood pressure with repeat measurement, I looked at both the initial drop (1st – 2nd measurement) and the slope over all 5 measurements. I observed a drop for systolic and diastolic pressure in both cases. Only the diastolic slope was statistically significant (95% CI does not overlap 0), but given that I see an effect for all four metrics and of consistent magnitude, the drop is likely real. That said, the drop is only ~0.5-1 mmHg/measurement, small enough to safely ignore for most experiments I plan to do.


Between-meter Reproducibility

Next, let’s look at the variation between meters. For this experiment, I used an older meter that I’ve been using daily for ~4 months and compared it to a newer meter of the same make/model that I bought when I mistakenly thought I had lost the original.

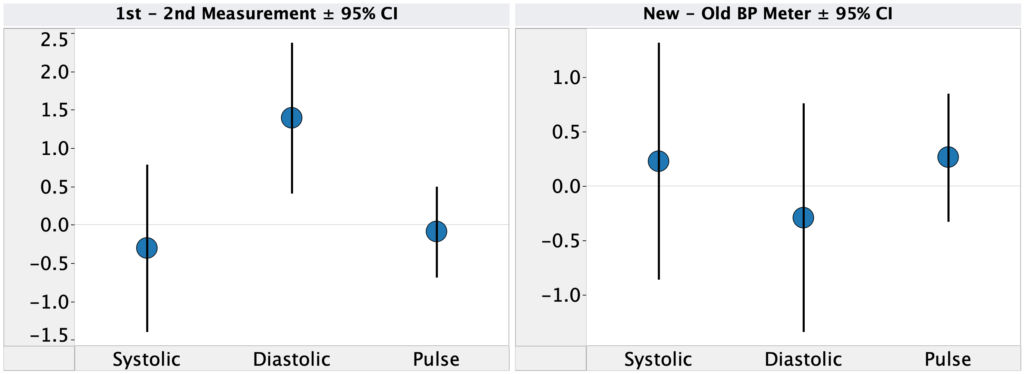
For the 56 paired reproducibility measurements, I alternated which meter I used first, giving me another data set to test for a drop in reading with repeat measurements. In this case, I saw a drop with diastolic pressure, 1.4 mmHg [0.4, 2.4 95% CI], but not systolic pressure, -0.3 [-1.4, 0.8 95% CI]. However, the confidence intervals are consistent with the previous measurements, again indicating the effect is likely real.

Comparing the two meters, there’s no measurable difference. Average difference is <0.3 mmHg with 95% confidence intervals comfortably overlapping zero. Since the older one has been used for ~4 months, that also indicates that there’s likely no change in the meter over time.


Conclusions & Next Experiments

Given the high observed variance, going forward I will start measuring sets of 5 repeat measurements for each observation. This gives an estimated 95% CI of 2.6 mmHg systolic. Still higher than I’d like, but it should allow me to identify reasonable effect sizes (I’ll, of course, need to do power calculations for each planned experiment).

Unfortunately, I’ve already finished my initial testing of deep breathing protocols using only single-point measurements. I’ll go ahead and analyze that data, but if the results are inconclusive, I will repeat the experiment with this new protocol.


– QD


Methods

Pre-registration

This experiment was not pre-registered.


Blinding

This experiment was not blinded


Procedure

  • General:
    • Blood pressure measurements we performed using an Omron Evolve blood pressure meter.
    • For each measurement, I placed the meter on my left arm, ~4 cm above my elbow. Measurements were taken seated, with my feet on the ground and arms resting on a flat surface at a comfortable height (same every time).
  • Repeatability
    • For 8 days, whenever I measured my blood pressure, I would repeat the measurement 5 times, with no breaks in between measurements.
  • Reproducibility
    • For 14 days, whenever I measured my blood pressure, I would repeat the measurement twice, once with each of two meters.


Data Visualization

Data was visualized using Tableau.


Data


Get new posts by email or rss feed