Request for Feedback: Experimental Design for Blood Pressure and Breathing Experiments

Get new posts by email or rss feed


Summary

I’m trying to identify causes and ways of reducing my elevated blood pressure and am looking for feedback on my experimental design & protocols.

Studies/Experiments:

  • Phase 1: Identify Potential Causes of Elevated Blood Pressure from Existing Self-Tracking Data
    • Approach (details below)
      • Use a mixed-effect model to look for look for significant correlations in data I’ve already collected.
      • If I find anything promising, design additional studies to confirm the relationship and test interventions.
    • Metrics to look at
      • blood glucose, sleep, exercise, weight/body, pulse, HRV
  • Phase 2: Testing Deep Breathing to Lower Blood Pressure
    • Approach (details below)
      • Measure blood pressure and pulse before & after the most well studied protocols as well as normal breathing.
      • If any protocols show significant reduction in blood pressure, optimize the protocol and design/execute an experiment to test the long term effect.
    • Analysis
      • Student’s t-test will be used to test if the blood pressure change for any of the protocols is different from that of normal breathing.

Questions:

  • Phase 1
    • Any other metrics I should be looking at?
    • Does this analytical approach seem reasonable? Are there different statistical approaches I should be taking (details below)?
  • Phase 2
    • Has anyone tried this? If so, what breathing protocols have worked for you?
    • Any suggestions for other interventions to try?
    • Any comments or critiques of the experimental design or analysis?
    • Anything else I should be measuring while doing this?

It would significantly improve these studies to have a larger number of participants. If you’re interested in collaborating on this or other scientifically rigorous self-experiments with blood pressure, low-carb foods, supplements, or other health interventions, please let me know in the comments or via the contact form on the right.


Details

Purpose

  • To identify environmental or controllable factors that have a significant impact on my blood pressure.
  • To quantify the effect of known interventions for reducing blood pressure.
  • To find a set of interventions that enable me to reduce my blood pressure below 120/80 mmHg.

Background
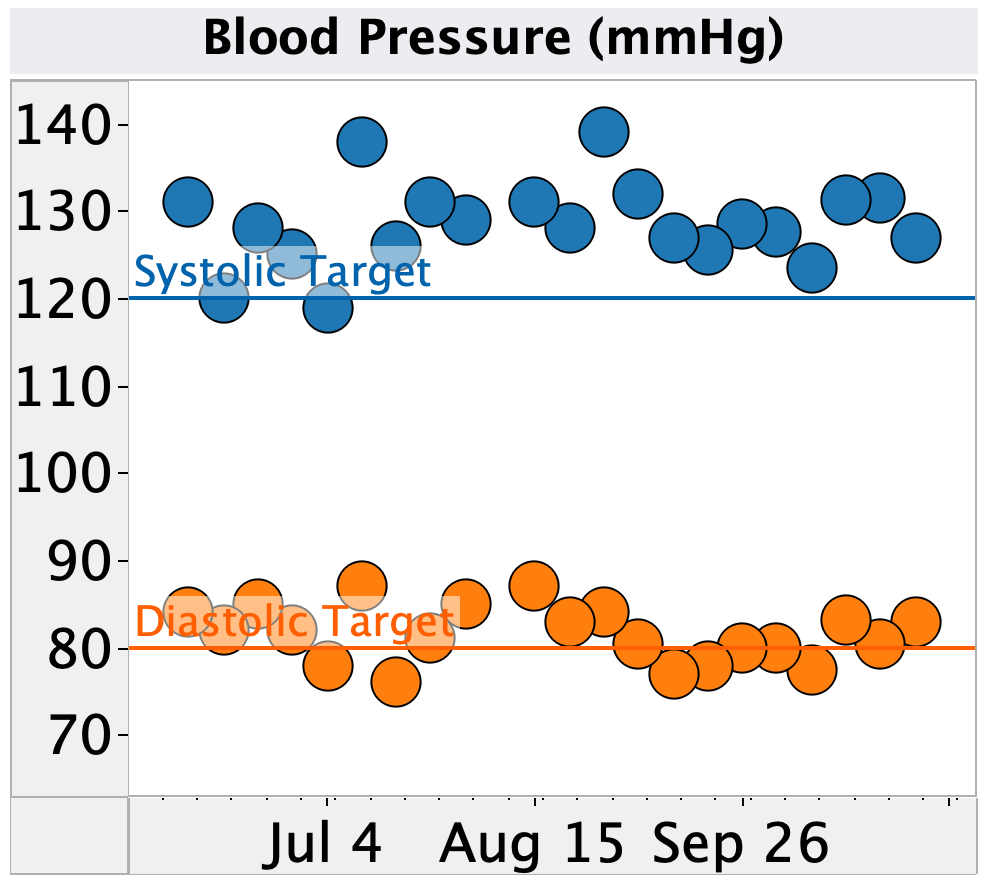
Figure 1. Weekly average of blood pressure as measured by Omron home blood pressure monitors.

I’ve been measuring my blood pressure over the past 4 months and it’s consistently over the American Heart Association target of 120/80 mmHg for “Normal” blood pressure. Of more concern, I frequently measure Systolic blood pressure of >130 mmHg, which is considered Stage 1 Hypertension.
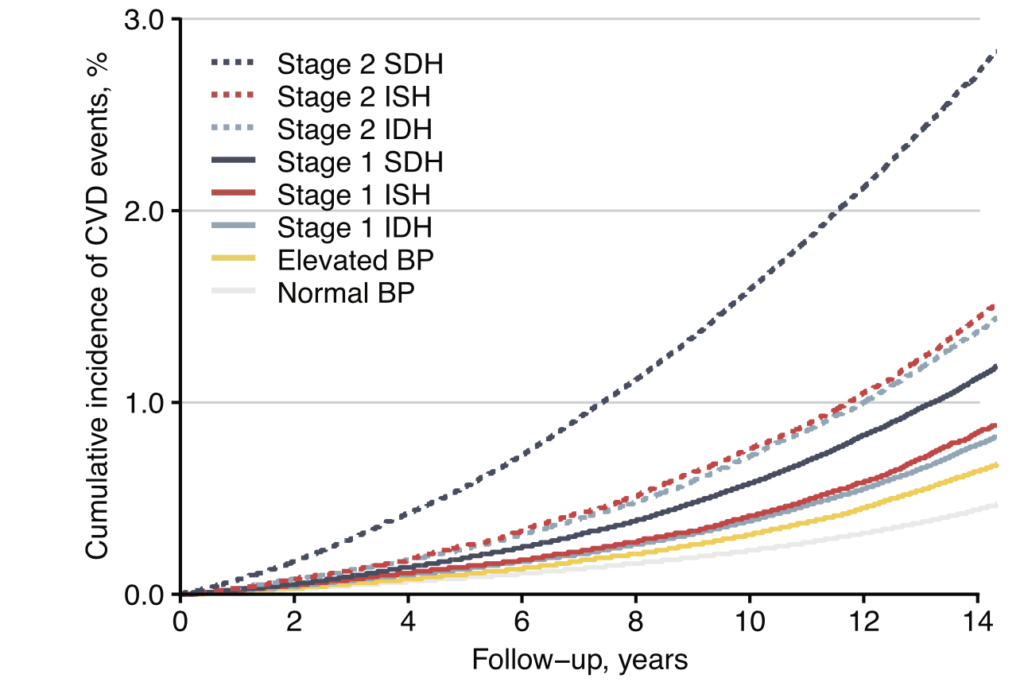
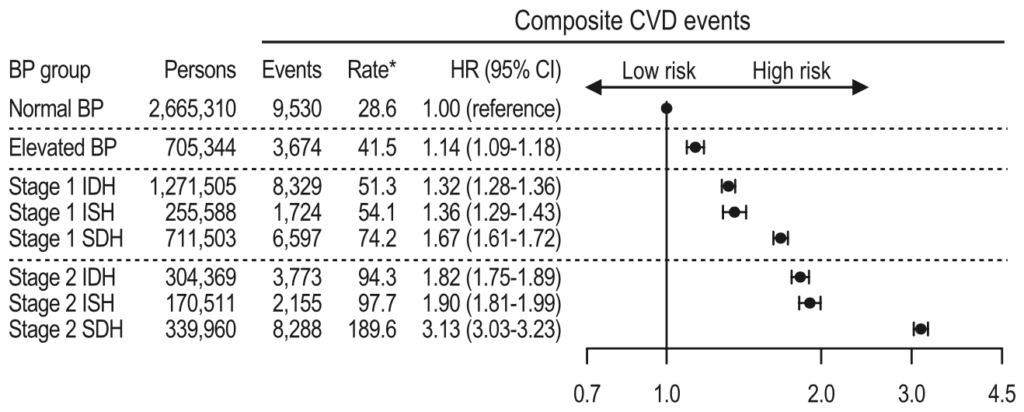
Elevated blood pressure is associated with an increased risk of cardiovascular disease (41.5/100k person years, hazard ratio 1.14 vs. normal BP, see Figure 2 and Table 1).

Figure 2. Cumulative incidence of cardiovascular disease vs. time for different blood pressure groups from a study of the South Korean nationwide health screening database (6.4M participants).
Table 1. Rate of cardiovascular disease for different blood pressure groups from a study of the South Korean nationwide health screening database (6.4M participants).

Given this, I’d like to see if I can reduce my blood pressure and reduce the strain on my heart and circulatory system.

There are numerous medications that lower blood pressure, but all risk of side effects. Before I pursue that route, I’d like to better understand the cause of my elevated blood pressure and see if any diet or lifestyle interventions can ameliorate it.

As mentioned above, I’ve been measuring my blood pressure for the past 4 months, along with blood glucose, sleep, weight, and exercise. This provides a (hopefully) rich dataset for identifying environmental or lifestyle factors that influence my blood pressure. Notably, I’ve noticed that my blood pressure is elevated on days after I’ve had low blood sugar the night before, indicating a possible effect (no statistical analysis done).

From an American Hearth Association evaluation of methods non-medication approaches to reduce blood pressure, with the exception of aerobic exercise (which I already do), the most well evidenced methods of reducing blood pressure are meditation and deep breathing.


Proposed Experiments

Phase 1: Identify Potential Causes of Elevated Blood Pressure from Existing Self-Tracking Data

  • Data
    • Blood pressure:
      • systolic and diastolic blood pressure
      • Measured by Omron Evolve
    • Glucose:
      • Same day: fasting BG
      • Previous day: average BG, time low (70, 60, & 50), time high (120, 140, 160), & coefficient of variation
      • Previous evening (after 7p): same as previous day
      • Measured by Dexcom G6
    • Sleep:
      • Time asleep, number of wake-ups, early rising (time woke before alarm)
      • Measured manually and by Apple Watch (less reliable but more data)
    • Other heart markers:
      • pulse (sleeping, morning, and awake), heart rate variability
      • Measured by Apple Watch and Omron Evolve
    • Body:
    • Exercise:
      • Type of exercise the previous day (aerobic vs. strength training) and frequency of aerobic exercise
      • Manually recorded
  • Analysis
    • A mixed effect model will be used to calculate the effect size, standard error, and p-value for the correlation between each metric and systolic and diastolic blood pressure
    • Effects will be of significant magnitude if a reduction of 5 mmHg can be achieved via a practical variation in the correlating metric.
    • Given the large number of metrics being looked at, I will use p-value thresholds of:
      • 0.02 for planning testing interventions
      • 0.05 for follow up experiments to confirm the correlation
      • 0.1 for further monitoring/assessment as I get more data
  • Questions
    • Any other metrics I should be looking at?
    • Does this analysis seem reasonable? Are there different statistical approaches I should be taking?

Phase 2: Testing Deep Breathing to Lower Blood Pressure

  • Background
    • Numerous studies, reviews, and meta-analyses have shown deep breathing to lower blood pressure in both the short and long-term (example 1, example 2).
    • Effect sizes are moderate (3-5 mmHg) and statistically significant for large patient populations (>10,000 patients in some studies).
    • Numerous breathing protocols have been tested, with varying results.
  • Approach
    • Measure blood pressure and pulse before & after the most well studied protocols as well as normal breathing.
    • For each protocol, measure at least three times. If the protocol shows a reduction in blood pressure, measure an additional 5 times to confirm.
    • Conduct measurements 1/day in the mornings.
    • If any protocols show significant reduction in blood pressure, optimize the protocol and design/execute an experiment to test the long term effect.
  • Measurement
    • Blood pressure and pulse will be measured with an Omron Evolve.
  • Analysis
    • Student’s t-test will be used to test if the blood pressure change for any of the protocols is different from that of normal breathing.
  • Questions
    • Has anyone tried this? If so, what breathing protocols have worked for you?
    • Any suggestions for other interventions to try?
    • Any comments or critiques of the experimental design or analysis?
    • Anything else I should be measuring while doing this?

Thanks in advance for your comments & feedback!


– QD

Get new posts by email or rss feed

Vinegar Study Phase 2 – A Palatable Protocol with the Same Effect as Concentrated Vinegar

Get new posts by email or rss feed


Acknowledgements: Thanks /u/genetastic for advice on the statistical analysis!

This post is an update on my experiments to quantify the effect of vinegar on blood glucose & to better understand the underlying mechanism by determining how this effect varies with person/metabolic status, dose, source of calories, and type of acid.

Previous posts in this series:

Phase 2 – Testing Diluted Vinegar

Summary

In Phase 1, /u/genetastic, /u/kabong, and I replicated the literature showing that vinegar can reduce the blood sugar impact of complex carbohydrates (white bread). From those experiments, we found that:

  • Vinegar significantly lowered blood glucose
    • Peak change in blood glucose & iAuC were reduced by 20% and time to peak blood glucose & initial rise were slowed by 15-20 min. (30-50%).
    • P-values were all <0.05, with the exception of the drop in iAuC, which was 0.12
  • The concentration of vinegar we used was extremely unpleasant to consume. So much so that I, at least, wouldn’t be willing to use it for additional experiments, much less daily life.

In this Phase, I tested a more palatable protocol, vinegar diluted in water (~30g vinegar in ~325g water) drank immediately before the meal. Here’s a summary of the results & next steps (full details below):

  • Diluted vinegar had a statistically significant and meaningful impact on blood glucose compared with no vinagar:
    • Peak change in blood glucose and iAuC were reduced by ~20% and time to peak was slowed by ~20 min.
    • P-value was <0.05 for the change in peak blood glucose, but not for iAuC and time to peak.
  • Diluted vinegar gave very similar results to undiluted, with virtually no change in peak blood glucose and only a modest increase in iAuC and decrease in time to peak. None of these differences were statistically significant.
  • These results give further evidence that the effect of vinegar on blood glucose is real and provide a practical protocol that can be used for further experiments. For the next phase, I will be testing the following:
    • Alternate macronutrients (simple sugars, proteins) to determine scope of the effect
    • Alternate acid sources to test the amylase-inhibition hypothesis
    • Whether this effect is significant with full meals, including insulin doses
      • For this last experiment, I will randomly drink 30g ACV in 325g water before my standard breakfast (50g ketochow, 2 tbsp butter, water to 12 oz total volume) and monitor BG impact.

It would significantly improve the study to have a larger number of participants. If you’re interested in collaborating on this or other scientifically rigorous self-experiments with low-carb foods, supplements, or other health interventions, please let me know in the comments or via the contact form on the right.


– QD

Details

Continue reading “Vinegar Study Phase 2 – A Palatable Protocol with the Same Effect as Concentrated Vinegar”

Low-Carb Flour Replacements: Initial Blood Glucose Testing & Request for Suggestions

Get new posts by email or rss feed


This post is an update on my experiments measuring the effect of low-carb foods and dietary supplements on blood sugar.

I’m still working my way through low-carb flour replacements, but since I’m running the vinegar experiment in parallel, it’s going to take a while to get through all of them.

In the meantime, I wanted to share my preliminary results and see if anyone has suggestions for additional low-carb flours to add to the study.

If you have any low-carb flour replacements you like or would like to see tested, please post it in the comments or send me a PM (contact form on the right).

Next week I’ll have an update on the vinegar experiments.


Testing Queue:


Flour Replacements

When making low-carb baked goods, I find that the most difficult ingredient to replace is flour. Flour provides bulk, absorbs water, and binds ingredients together, creating the structure of most baked goods. Unfortunately, it’s ~75% starch by weight with a glycemic index of 70, resulting in an extremely high impact on blood sugar.

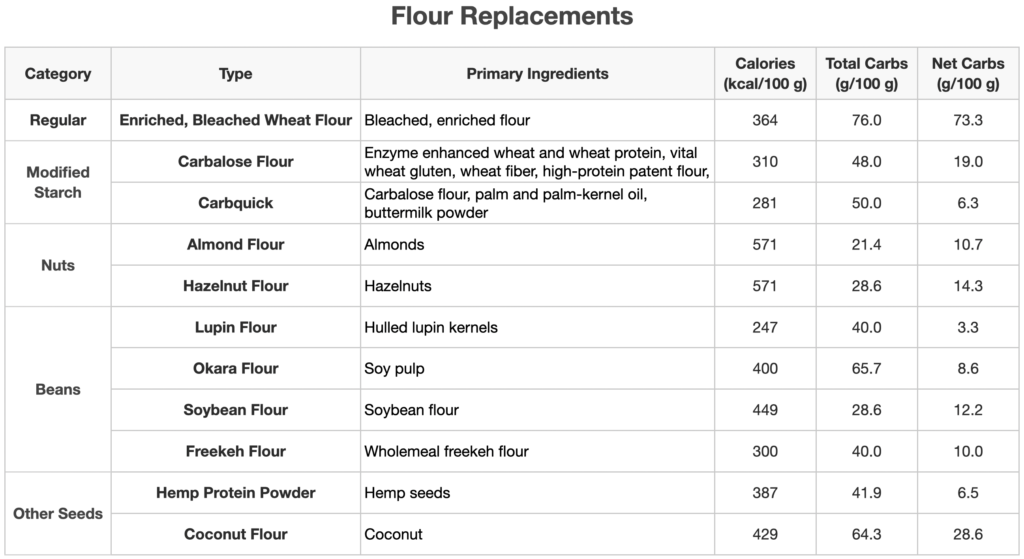
Historically, there hasn’t been a lot of low-carb replacements for flour available, mostly almond flour, coconut flour, and resistant starches. Similar to other low-carb products, a ton of new flour replacements have hit the market in the last few years. As always, the net carb counts look good, but I wanted to test them to see if they really hold up (see evidence of blood glucose impact of dietary fibers here & here).

So far, I’ve found 11 flours to test:

  • Baseline:
    • Wheat flour
  • Modified starches
    • Carbalose flour
    • Carbquick
    • Freekeh flour
  • Nuts:
    • Almond flour
    • Hazelnut flour
  • Beans:
    • Lupin flour
    • Okara flour (from soybeans)
  • Other seeds:
    • Coconut flour
    • Hemp protein powder
    • Flaxseed meal
    • Psyllium husk powder

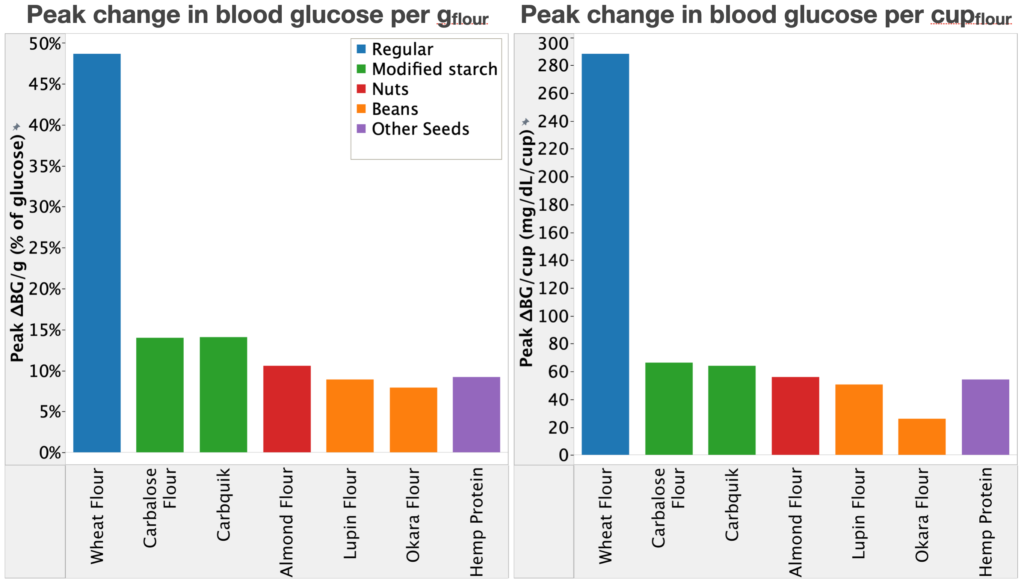
I’ve gotten through 7 so far and all have been pretty good, with peak ∆BG of 16-29% of wheat flour by weight and 9-23% by volume (see chart below).

As mentioned above, since I’m running the vinegar experiment in parallel, it’s going to take a while to get through the remaining flours. Once I do, I’ll post a full update with more detail on taste, texture, and the full blood glucose analysis.

In the meantime, since I’ve gotten such great recommendations from the readers, I wanted to solicit suggestions for additional low-carb flours to add to this study.

If you have any low-carb flour replacements you like or would like to see tested, please post it in the comments or send me a PM (contact form on the right).

I’ll test all the requests over the next couple weeks and post the results.


– QD


Get new posts by email or rss feed

Does Vinegar Really Lower Blood Glucose? – 20% Lower Blood Glucose in an N=3, Pre-Registered, Community Experiment

Get new posts by email or rss feed


Thanks to the team for all the work they put in figuring out the protocol, running the experiments, and analyzing the data: /u/genetastic and /u/kabong!

Summary

A reader, /u/genetastic, reached out about collaborating on experiments to determine the effect of vinegar on blood glucose after meal consumption.

Like most of you, I had heard all the nigh-magical, pseudoscience claims about using apple cider vinegar to treat diabetes. However, when you dig into the literature, there’s a sizable number of peer-reviewed studies, including several decent meta-analyses, showing that consumption of vinegar with a meal can reduce the blood glucose impact in both diabetic and non-diabetic subjects (see background below for details). There’s also a lot of open questions, including:

  • Is the effect large enough to matter for practical meals?
  • What types of meals does vinegar affect?
  • What is the best protocol to get a large effect without unpleasant side effects?
  • What’s the underlying mechanism?
  • Is the effect specific to vinegar or do other acids work?

/u/genetastic, a third collaborator /u/kabong, and I decided to answer these questions with community self-experiment.

For the first phase of this experiment, we wanted to check that we could observe the reported impact of vinegar on blood sugar and that the effect size was large enough to be worth further study.

Towards this end, all three experimenters tested consuming regular white bread with and without apple cider vinegar (the most commonly tested meal and vinegar source in the literature).

Here’s a summary of the results & next steps (full details below):

  • We observed a similar effect of vinegar on blood glucose as that reported in the literature.
  • The effect was both statistically significant and meaningful in magnitude, justifying further study of the scope, mechanism, and optimal protocol.
    • Peak change in blood glucose & iAuC were reduced by 20% and time to peak blood glucose & initial rise were slowed by 15-20 min. (30-50%).
    • P-values were all <0.05, with the exception of the drop in iAuC, which was 0.12
  • Next, we will be looking at the following:
    • Diluting vinegar to make it more palatable
    • Alternate macronutrients (simple sugars, proteins) to determine scope of the effect
    • Alternate acid sources to test the amylase-inhibition hypothesis

All-in-all, a good start to the study. The effect seems to be real and likely caused by a slowing of the initial rise/rate of metabolism.

We’re also see a lot of value to running the experiment as a team rather than my more typical N=1 study. With most of my experiments, there’s always a concern that the results are specific to my body chemistry and won’t generalize to others. Having data from multiple people significantly reduces that risk.

That said, having data from multiple participants significantly complicates the analysis. Luckily, /u/genetastic is much better at statistics than I am and was able to handle it.

It would significantly improve the study to have a larger number of participants. If you’re interested in collaborating on this or other scientifically rigorous self-experiments with low-carb foods, supplements, or other health interventions, please let me know in the comments or via the contact form on the right.


– QD


Details

Continue reading “Does Vinegar Really Lower Blood Glucose? – 20% Lower Blood Glucose in an N=3, Pre-Registered, Community Experiment”

Low-Carb Chocolate: Blood Glucose Testing of 13 Varieties with Promising Results

Get new posts by email or rss feed


This post is an update on my experiments measuring the effect of low-carb foods and dietary supplements on blood sugar.

This week, I have the results from low-carb chocolates. Next week I’ll starting testing and posting flour replacements and other ingredients.


Testing Queue:

  • Prepared foods:
    • Snack bars: in queue
    • Chocolate: This post
  • Ingredients:
    • Flour replacements: in queue
    • Seeds & nuts: in queue
    • Vegetables: in queue
  • Supplements:

Chocolate

Summary

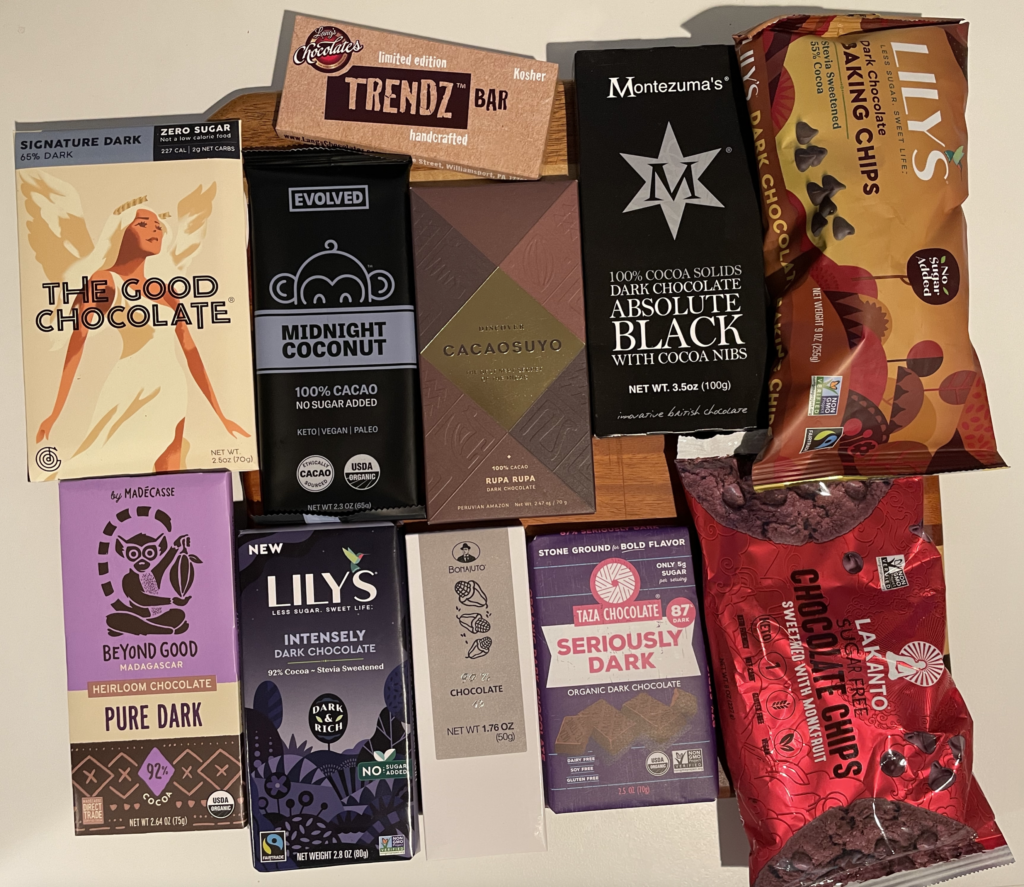
Since I’ve started posting these food-effect studies, one of the most requested products has been low-carb chocolate. As with other low-carb products, a ton of new low-carb chocolates have become available. Initially, most used a simple substitution of a non-nutritive sweetener, like erythritol, for sugar. However, I’ve noticed in the last few years, a number of high cocoa/low sugar chocolates that use regular sugar, just in very low quantities (90-100% cocoa).

In both cases, the net carb count can be very low, though this largely relies on subtracting the high fiber content of the cocoa. Since I’ve had very mixed results with the blood glucose impact of dietary fiber (see here & here), I tested them myself.

Towards that end, I tested 13 chocolates from 4 different categories (grouped by sweetener). Here’s my overall conclusions:

  • Lowest BG impact: Lily’s Almond Dark & The Good Chocolate Signature Dark
    • ~65% of the impact of 100% cocoa bars
  • Best combination of taste & impact: Taza Wicked Dark & Trendz Bar
  • Chocolate with added fiber shows much higher blood glucose impact
    • There’s a significant variation between brands
    • This could be due to different fiber type or quantity
  • Watch out for the ChocZero chocolate, which gave ~2x the BG impact of the next highest chocolate.

Evidence continues to pile up that there’s a large variation in the impact of different fibers, even ones with the same name listed on the nutrition label. I’m going to see whether I can source a decent variety to test.

If anyone knows where to get the fibers and resistant starches that are used in low-carb prepared foods (especially from the actual manufacturers), please let me know in the comments or by PM.

As always, please let me know if you have any thoughts, suggestions, or anything else you’d like to see me test.


– QD


Details

Continue reading “Low-Carb Chocolate: Blood Glucose Testing of 13 Varieties with Promising Results”