Experiment #3: Exercise Effect

Get new posts by email or rss feed


From my two days of “continuous” tracking, I saw sharp drops in blood sugar during cardio exercise, followed by a return to baseline over 30-45 min. During these drops, I was going extremely low, almost 40 mg/dL. I didn’t have any physical symptoms that I could tell, but this worries me enough that I want to understand the phenomenon better and see if there’s a way to mitigate it.

Towards this end, over the last week, whenever I exercised, I measured my blood glucose before and at 15 min. intervals after exercise until my BG had recovered to baseline or I did something that would change my BG (ate, took medicine, etc.).


Key Learnings:

  • The drop after exercise is large and significant, averaging 25 mg/dL for a 200 kCal bike ride and 10 mg/dL for MMA and strength training.
  • With one exception, whenever I could measure, my BG recovered to baseline within 45 min. and usually started to come back up within 15 min. 
    • This indicates I’m not in any danger with my current exercise regime, but should reassess if I significantly change the intensity, duration or type of exercise.
  • There are no clear trends in the magnitude of the drop of recovery time with anything I measured, but there are hints of effects with intensity, time of day, and type of exercise. I need to collect more data.


Next Experiments:

I’m always interested in ideas for new experiments, so please leave a comment if there’s something you’d like me to try.

  • Exercise studies: Continue to collect data, varying intensity and type of exercise to try to figure out trends.
  • Long peak from breakfast & lunch: Measure blood glucose at 15 min. intervals a few more times after breakfast & lunch. Try varying protein and fiber content to see if those are the causes. Try normal-acting insulin to mitigate.
  • Food & medication studies: It’s proving difficult to disentangle the numerous effects going on at any given meal by adding or subtracting particular foods (data too noisy, too many measurements required to observe a statistically significant effect). Instead:
    • Skip meals and medication to measure background trends.
    • Consume individual ingredients (glucose, protein, fiber, etc.) or take individual medications to measure their direct effects.
    • Measure combinations of ingredients and medications to measure interaction effects.
    • This will require more experiments, but I think in the end it will require less time & effort

Details

Purpose

Determine the short term effect of exercise on my blood sugar and if I am in danger of a severe hypoglycemic event.


Design/Methods

General. Blood glucose was measured using a FreeStyle Freedom Lite glucose meter and FreeStyle lancets & test strips. No special precautions were taken to clean the lancing site before measurement. To take a sample, the lancing devices was used to pierce the skin at an ~45 deg. angle from the finger. Blood was then squeezed out by running the thumb and pointer finger of the opposite hand from the first knuckle to the lancing site of the finger. Blood was then wicked into a test strip that had been inserted into the meter and the glucose reading was recorded.

Measurements were taken before exercise and at 15 minute intervals after exercise until my blood sugar had returned to the baseline value or I did something that would change my BG (ate, took medicine, etc.).

Recovery time was calculated as the time until blood glucose returned to within 5 mg/dL of the value before the start of exercise.

For bicycling, I used a stationary bike and recorded the reported calories burned. This is almost certainly inaccurate, but appears to be a consistent function of the pedaling speed and resistance setting. As such, I used it as a quantitative measure of the intensity of the exercise.


Data

Link


Results & Discussion

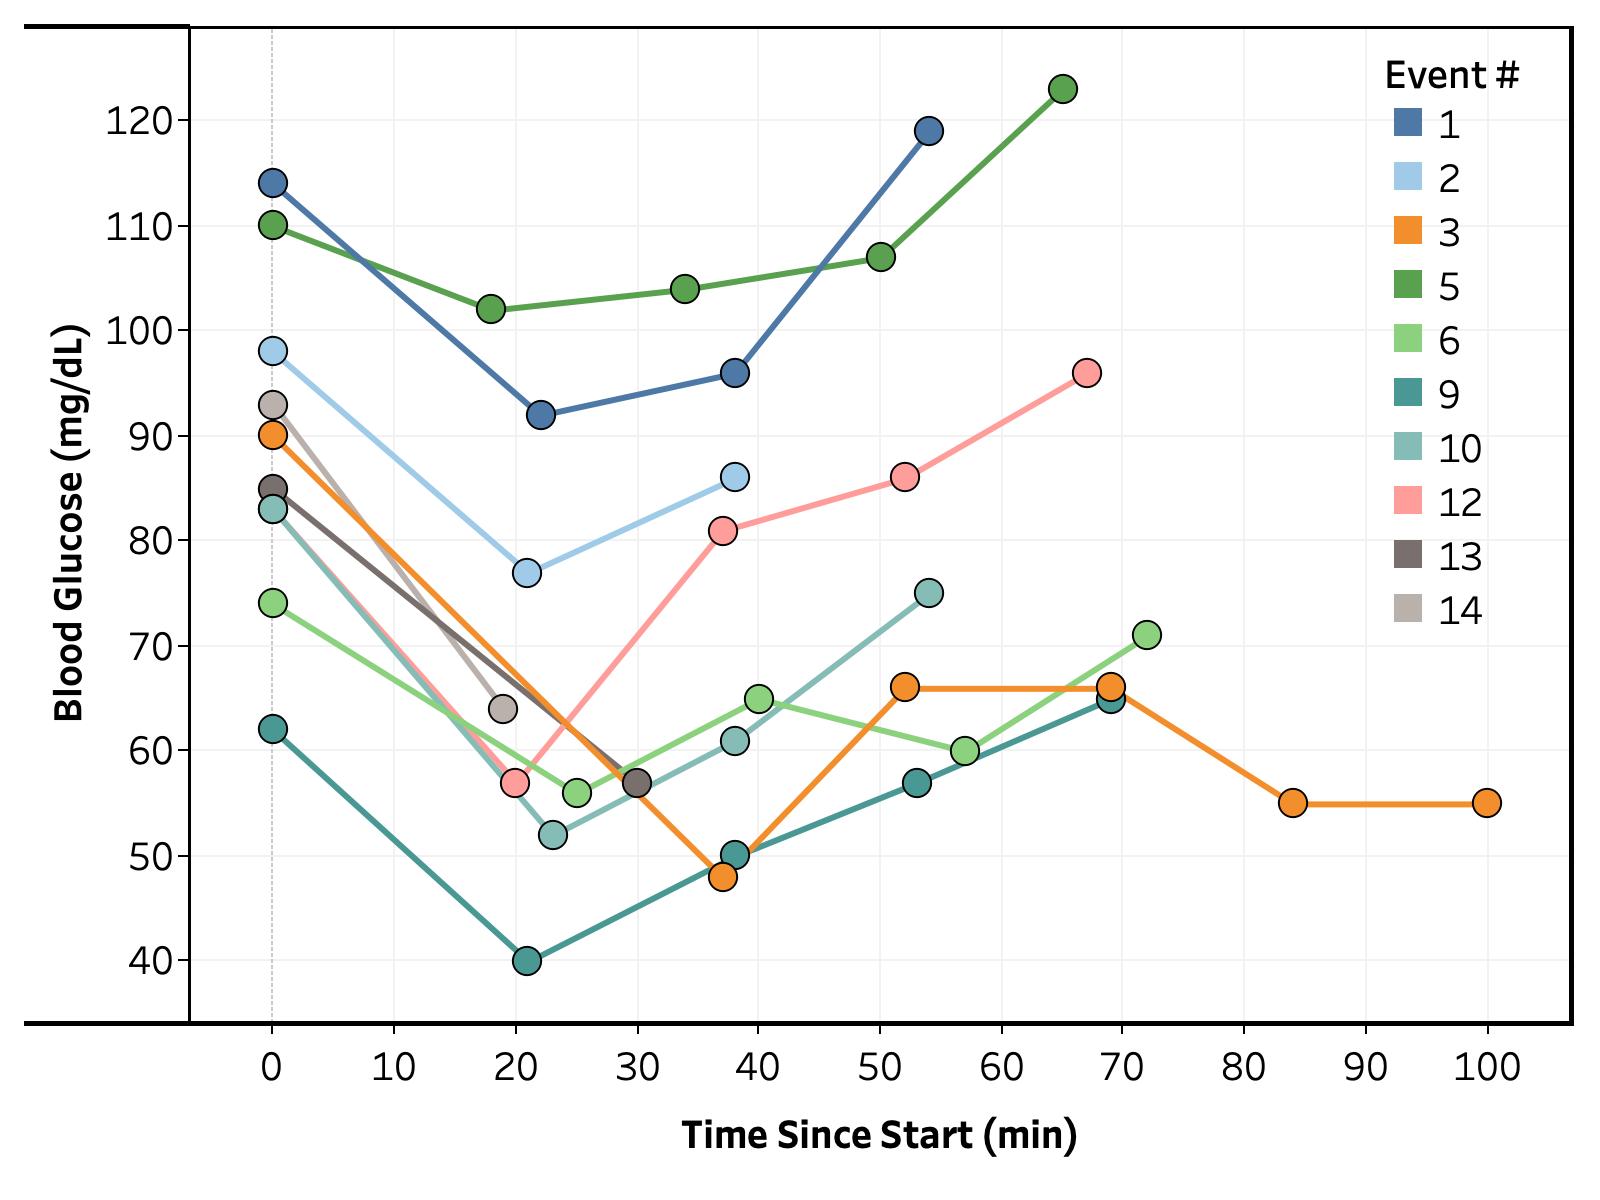
Figure 1. Blood glucose vs. time before and after biking
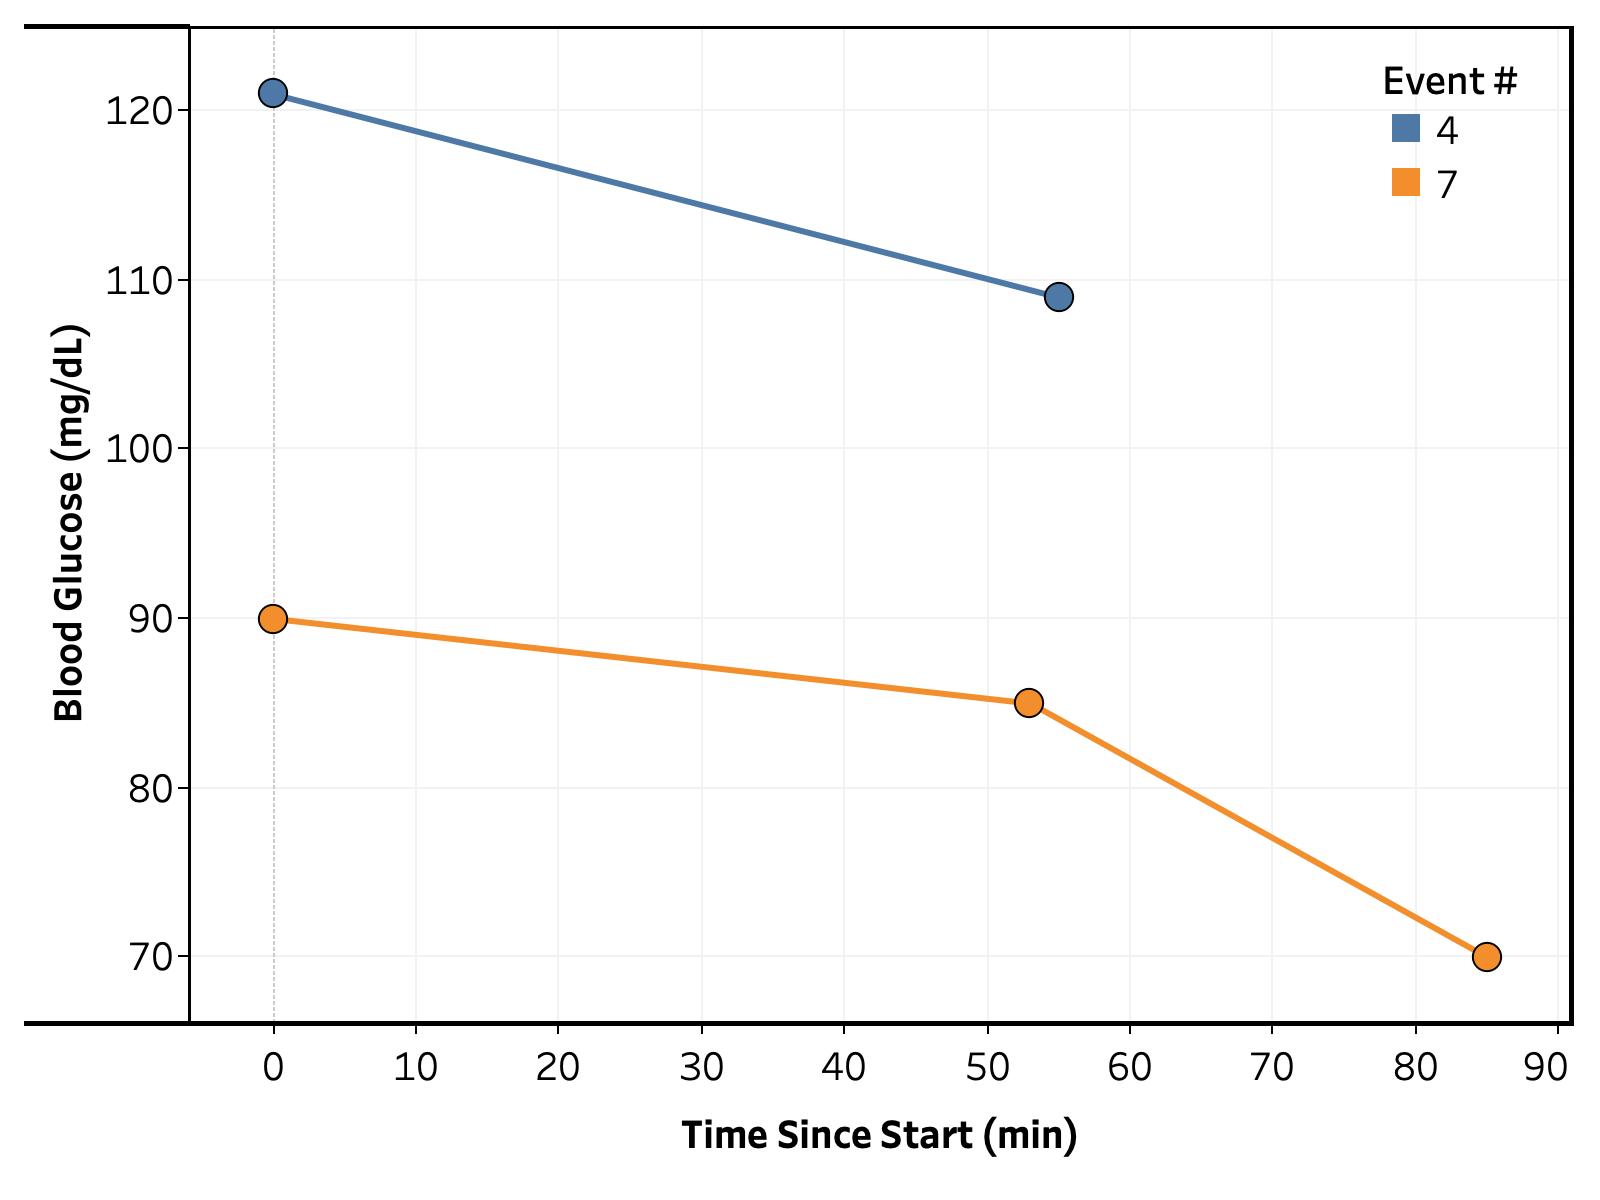
Figure 2. Blood glucose vs. time before and after strength training
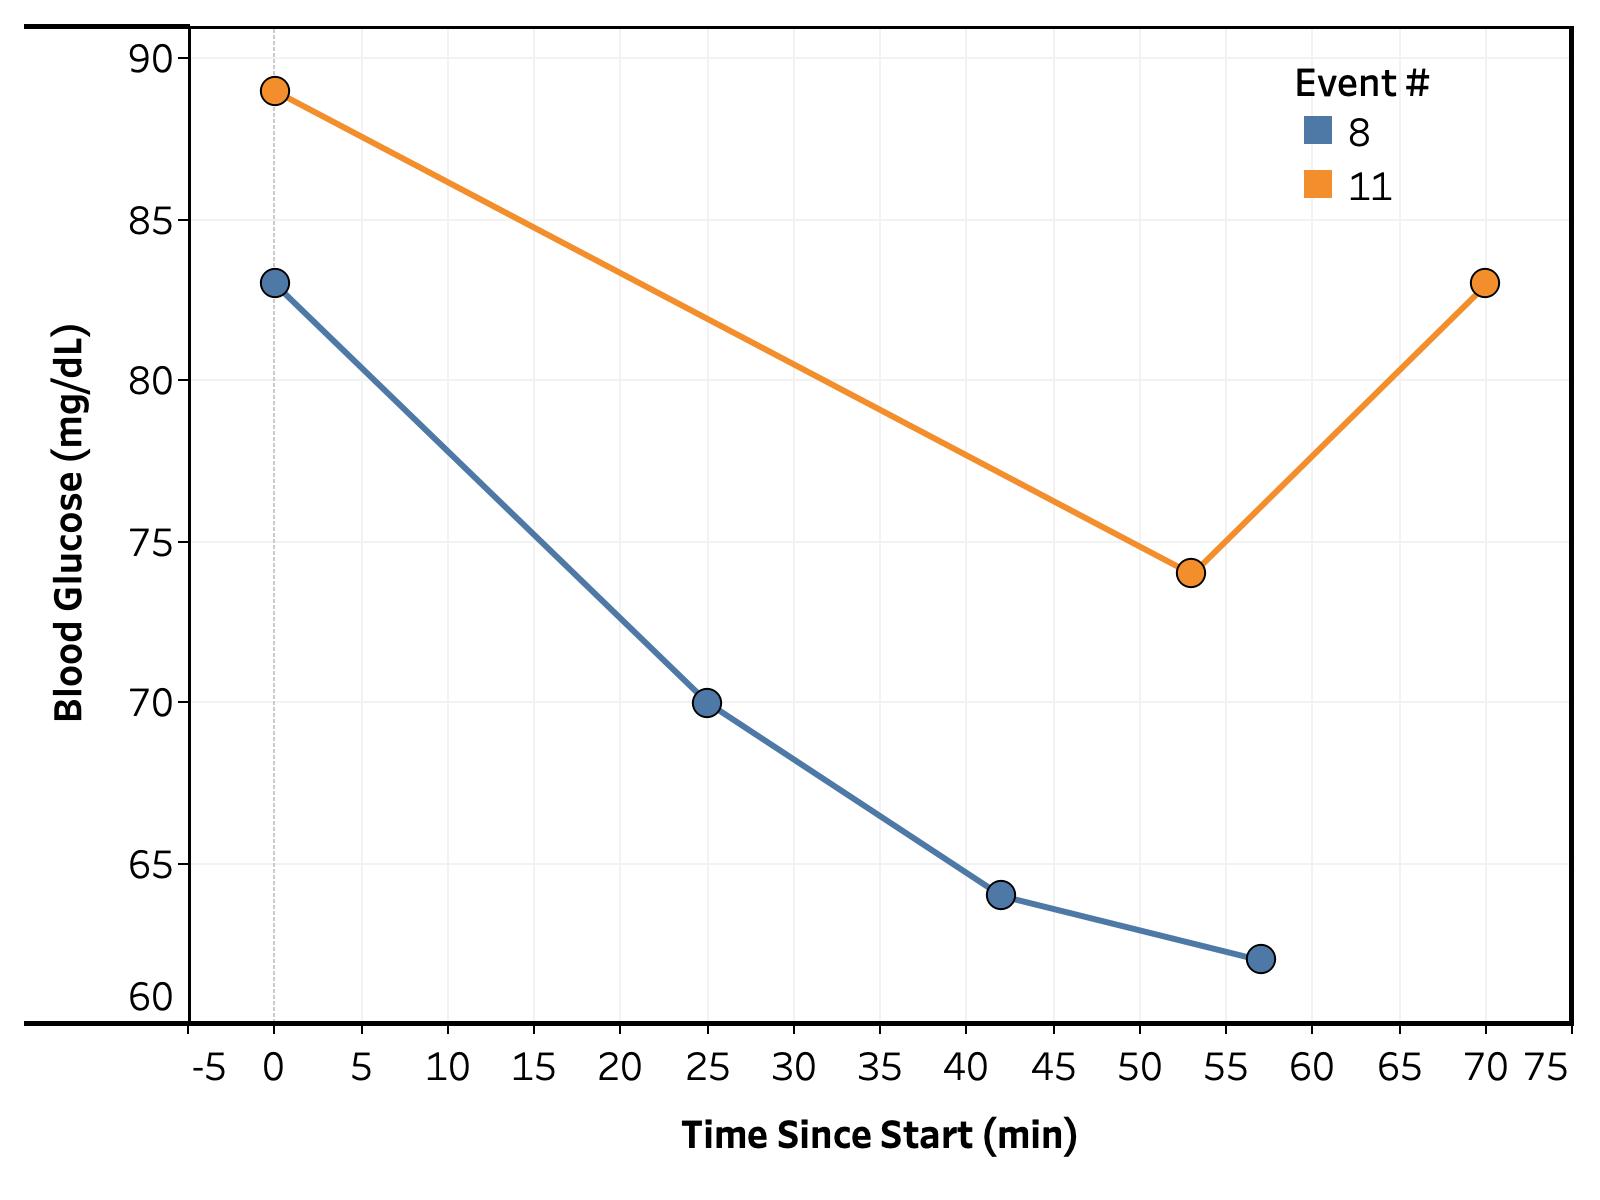
Figure 3. Blood glucose vs. time before and after MMA

Overall. The full set of BG vs. time traces are shown in Figures 1, 2, and 3. The data roughly corresponds to the previously observed trend, a drop in BG during exercise followed by recovery over 15-60 minutes. To get a better understanding of what’s going on, I calculated the change in blood glucose from the initial measured value and bucketed readings in 15 minute intervals from the end of exercise (i.e. 15, 30, 45, and 60 min. post-exercise).
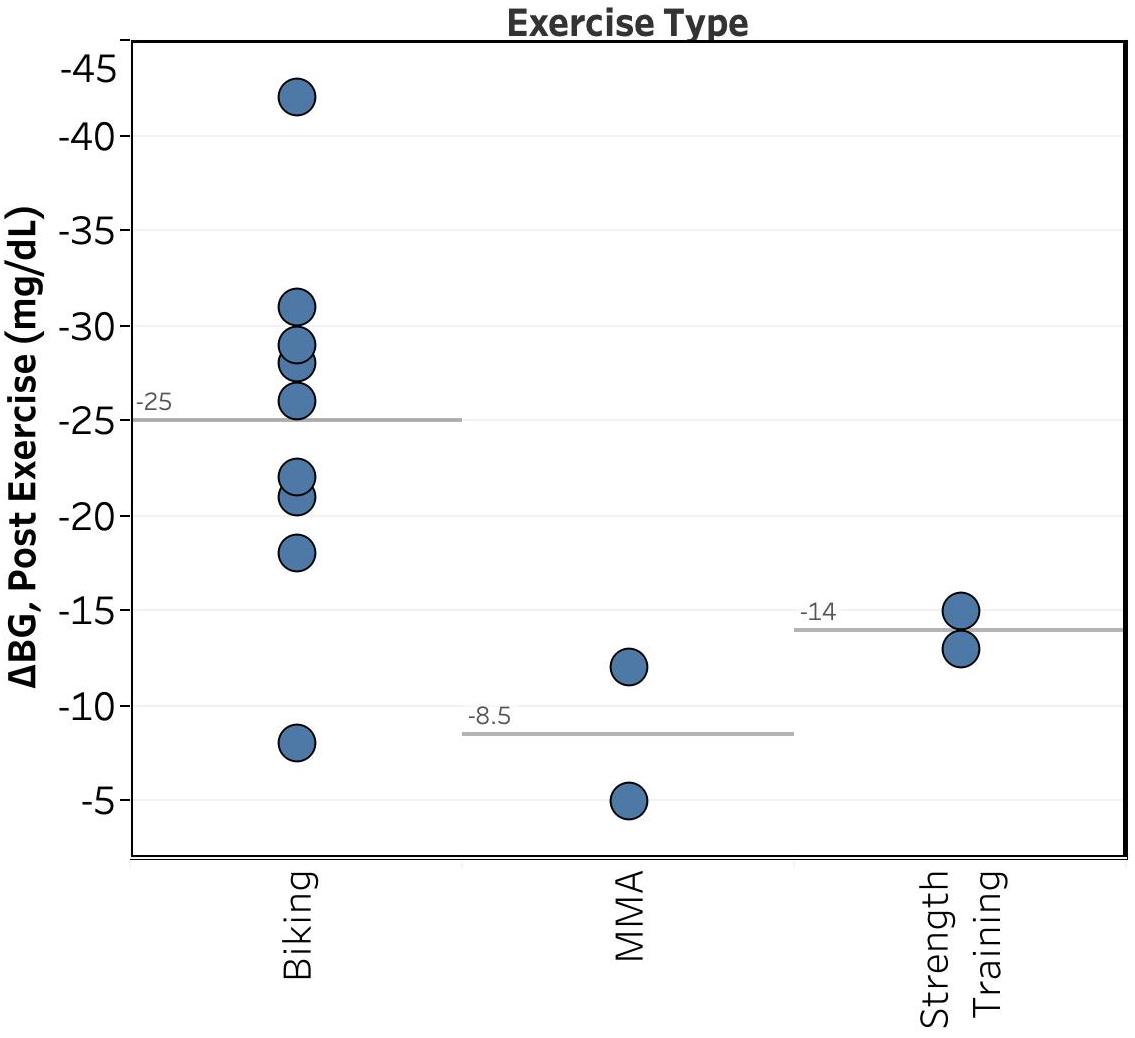
Figure 4. Initial BG drop vs. type of exercise. Reference lines show average value.

Type of Exercise. Unsurprisingly, as shown in Figure 4, the type of exercise had the largest effect on the magnitude of my drop in BG, with biking showing an average drop of 25 mg/dL and MMA & strength training showing average drops of ~10 mg/dL. 

Unfortunately, it’s difficult to draw any conclusions from this, as I do different types of workouts at different times of day (e.g. MMA on weekday mornings, biking & strength training on weekend mornings or weekday evenings).
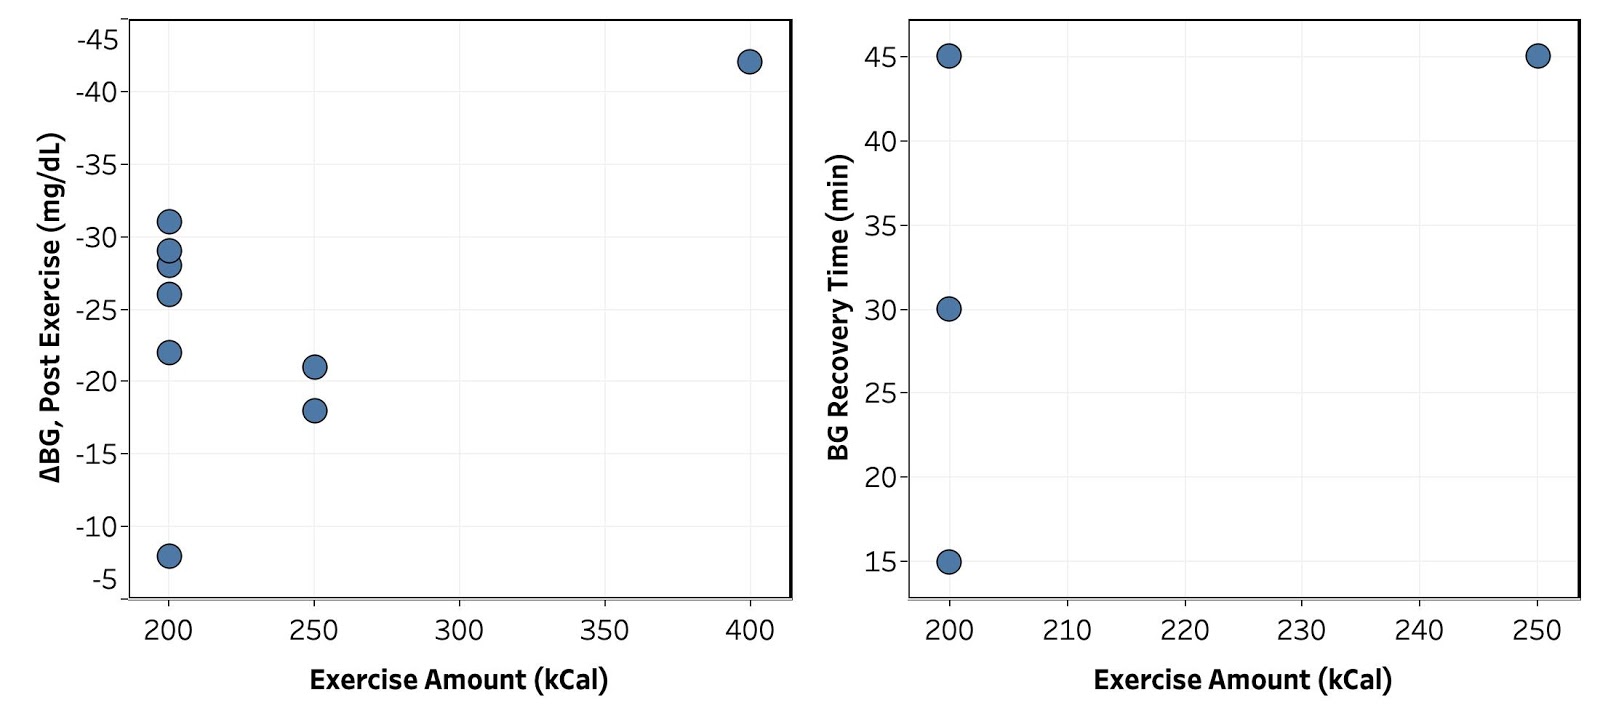
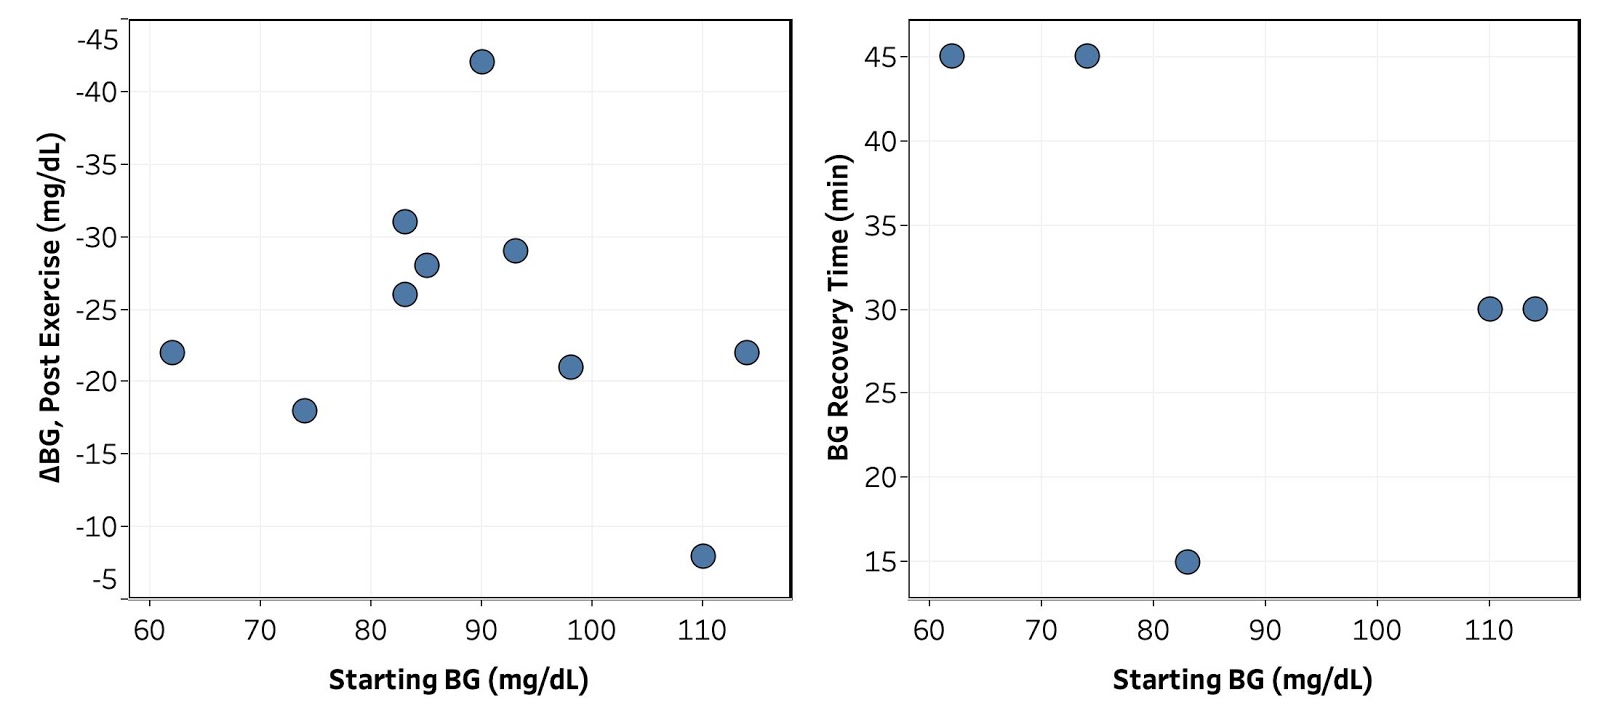
Figure 5. Initial BG drop and recovery time vs. exercise intensity.
Figure 6. Initial BG drop and recovery time vs. initial BG.
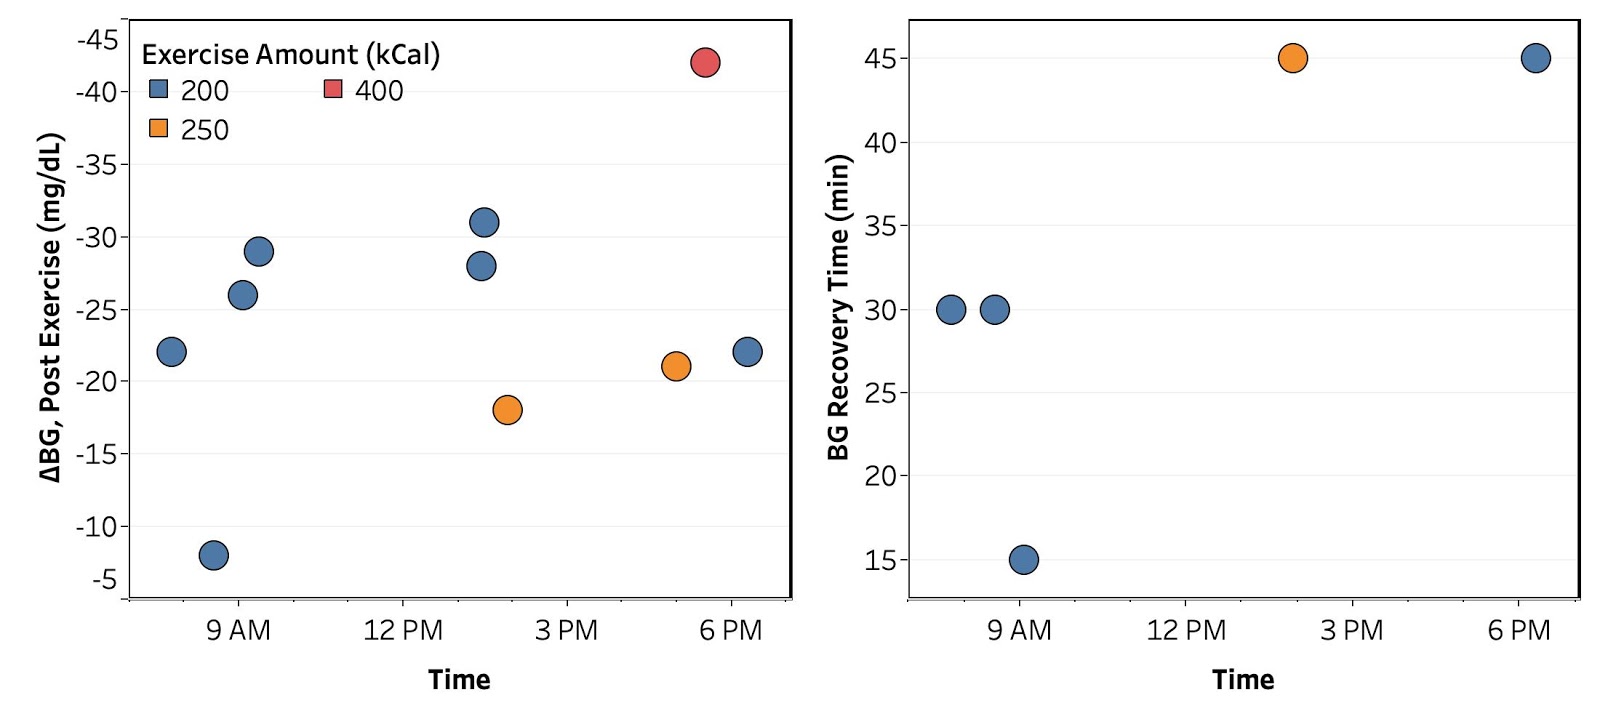
Figure 7. Initial BG drop and recovery time vs. time of day.
Figure 8. Recovery time vs. initial BG drop.

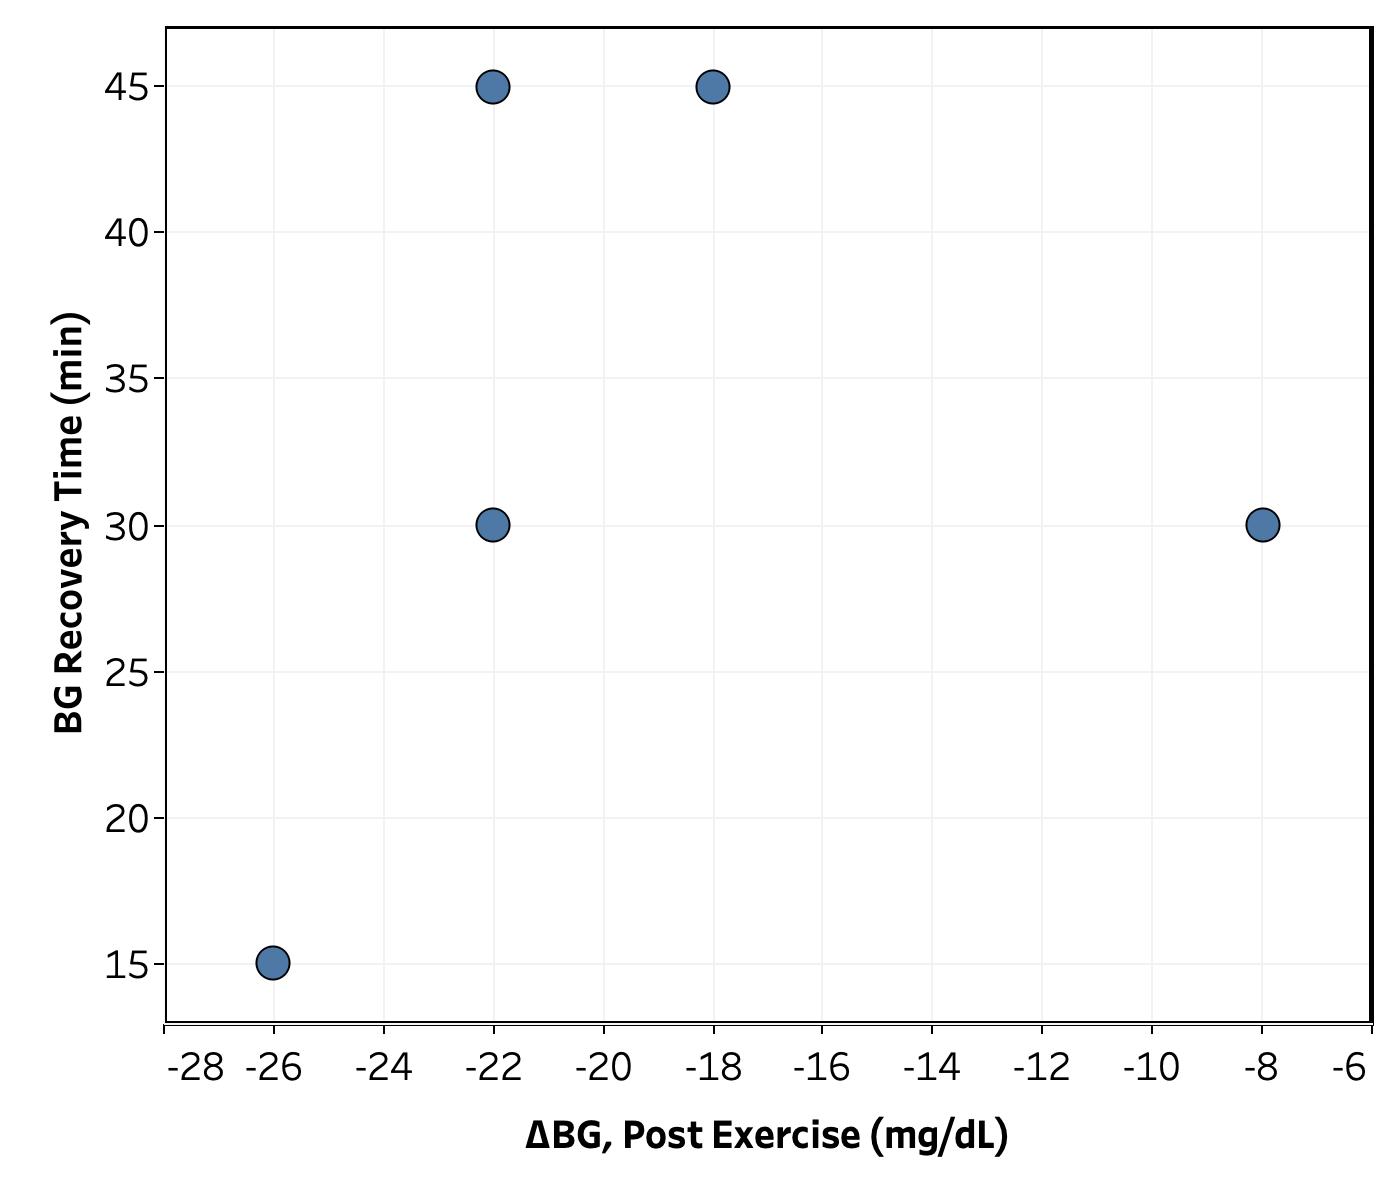
Exploratory Analysis of Trends. I next attempted to see if there were any trends in the BG effect with intensity of exercise, starting BG, or time of day. As shown in Figures 5, 6, 7, and 8, the amount of data I have so far is not sufficient to determine any clear trends. However, a there are hints of a few possibilities:

  • Figure 5: Initial BG drop may be positively correlated with exercise intensity. This conclusion relies on a single data point from a 400 kCal bike ride and so is highly suspect.
    • Need to get more data at different intensities. May also need a better measure of intensity. Maybe look at both kCal and duration of ride? 
  • Figure 6: Initial BG drop and recovery time show a maximum and minimum, respectively, when initial BG is close to “normal” (80-95 mg/dL). Again, not nearly enough data to have any confidence in this conclusion, but worth looking at again when I have more data.
  • Figure 8: With one outlier, recovery time increases as the BG drop gets smaller. This is a counterintuitive to me and also worth keeping an eye on.

Conclusion

See summary above. All-in-all, this initial data is promising and allays my worry about a dangerous hypoglycemic event during exercise, but I need to get more data in order to get anything interesting out of it. I’ll keep monitoring and post again when I’ve learned more.


– QD

Get new posts by email or rss feed

Recruiting for Community Self-Experiment: How do Hot Showers Affect Blood Glucose?

cross-posted to r/diabetesr/diabetes_t1r/diabetes_t2r/QuantifiedSelf, and the Quantified Self Forum to recruit as many participants as possible. I’m also posting it here in case there’s anyone who reads the blog who’s not in any of those forums (not likely, but might as well).

A few days ago, u/NeutyBooty posted on how hot showers caused their blood glucose to rise. Lot’s of commenters confirmed the general observation, but for some it appeared to be a CGM artifact, for some it matched their finger-stick meter, and others they see a BG drop.

I’ve been interested in self-tracking and experimentation for a while and this seems like a perfect opportunity for a communal self-experiment.

We currently have 7 Redditors participating from the original thread, but I’m hoping we can get even more people signed up so we can get a really great data set. Anyone’s who’s interested in participating, please comment or PM me.

The basic idea is to agree on a simple experimental protocol, each of us run the experiment, combine and analyze the data, and see if we can figure out 1) Is the shower effect real or a CGM artifact and 2) how does it vary from person-to-person?

The 7 of us organized and worked out the protocol using group chat and and a new subreddit, r/QuantifiedDiabetes. We’re starting the experiments and looking for more participants.

Here’s the details:

  • Background:
    • In u/NeutyBooty‘s post on hot showers causing blood glucose to rise, lot’s of commenters confirmed the general observation, but for some it appeared to be a CGM artifact, for some it matches BGM, and for others they see a BG drop.
    • From my PMs, some of us have CGM’s, some have regular BGM’s, and some have both.
  • Questions to answer:
    • Is the “hot shower effect” a real change in blood glucose or an artifact of CGM sensors getting warm (or some other environmental change)?
    • What is the person-to-person variation in the magnitude and direction of the “hot shower effect?”
  • Protocol:
    • Pick a time when your blood glucose is relatively stable (no recent meals, medication, exercise, etc.)
    • Turn on the shower to the hottest temperature you’re comfortable with and let the temperature stabilize. If possible, measure the temperature (e.g. with an instant read thermometer).
    • Measure your blood glucose with both a CGM and regular finger-stick meter and record the data.
      • If you don’t have both types of meters, use whichever you do have (data will still be useful for the second goal)
    • Take a 20 minute shower.
    • As soon as you finish the shower, measure your blood glucose again with both a CGM and regular finger-stick meter and record the data.
    • Monitor your blood sugar for one hour (measure every 15 min. for finger-stick meter)
    • Record anything that might have affected blood glucose during the experiment.
    • Repeat the experiment multiple times (preferably ≥3, but any data is better than nothing) to assess within-person variability.
    • Post your data in a comment or PM to u/sskaye. I’ll compile it and make available to everyone to analyze
      • If you want your data to be anonymous, just let me know and I’ll remove all identifying info.
    • Optional variations:
      • Vary the time or temperature of the shower
      • Try a bath, hot tub, or sauna instead of a shower.
  • Data to collect:
    • For each glucose measurement: time, blood glucose, any important observations
    • General: whatever demographic info you’re comfortable sharing (e.g. male/female, T1/T2/LADA, age)

Get new posts by email or rss feed

Experiment #2: 48 hours of Blood Sugar Tracking

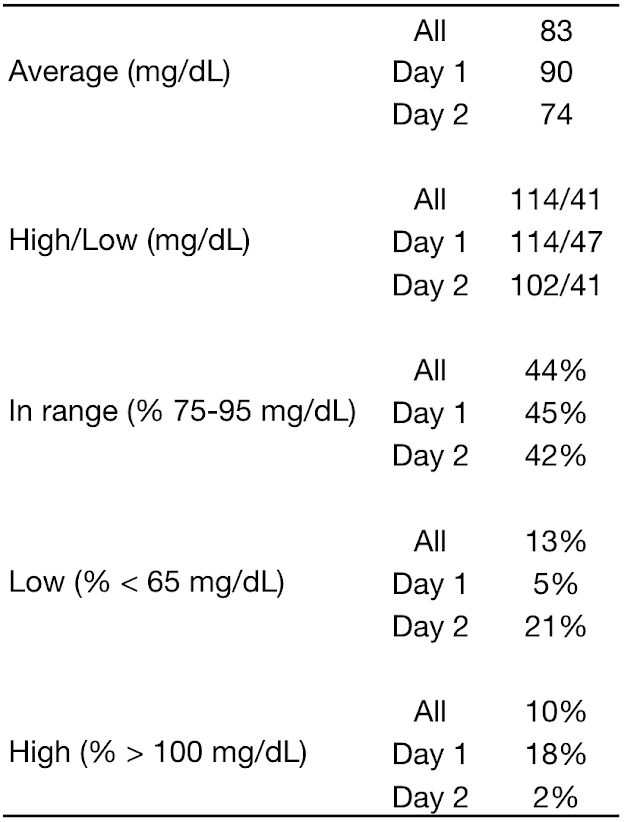
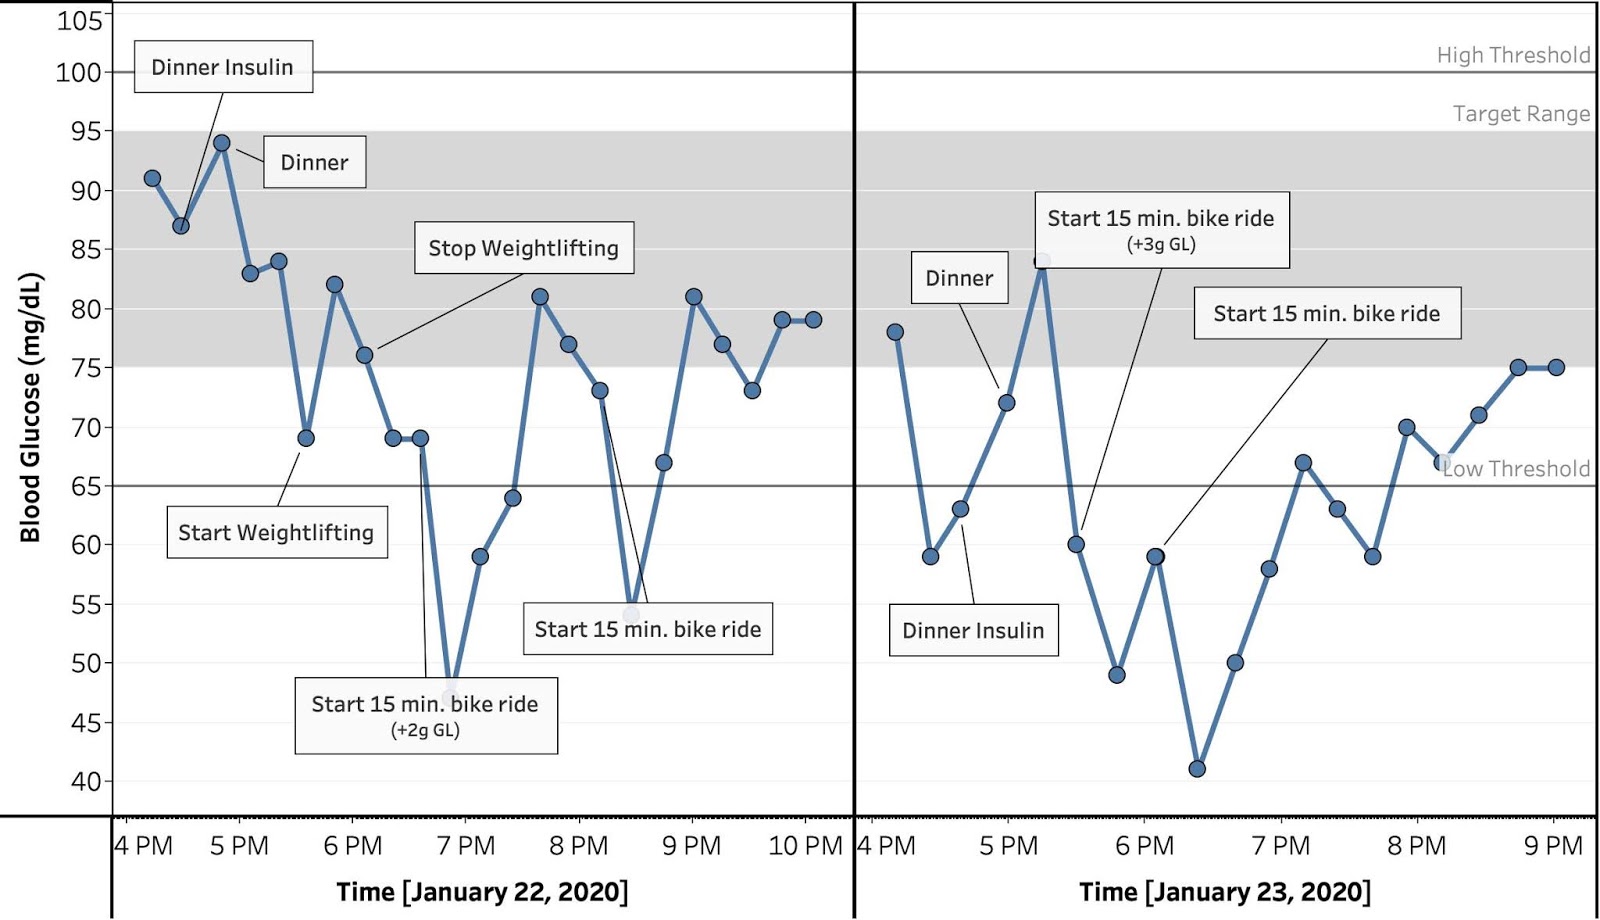
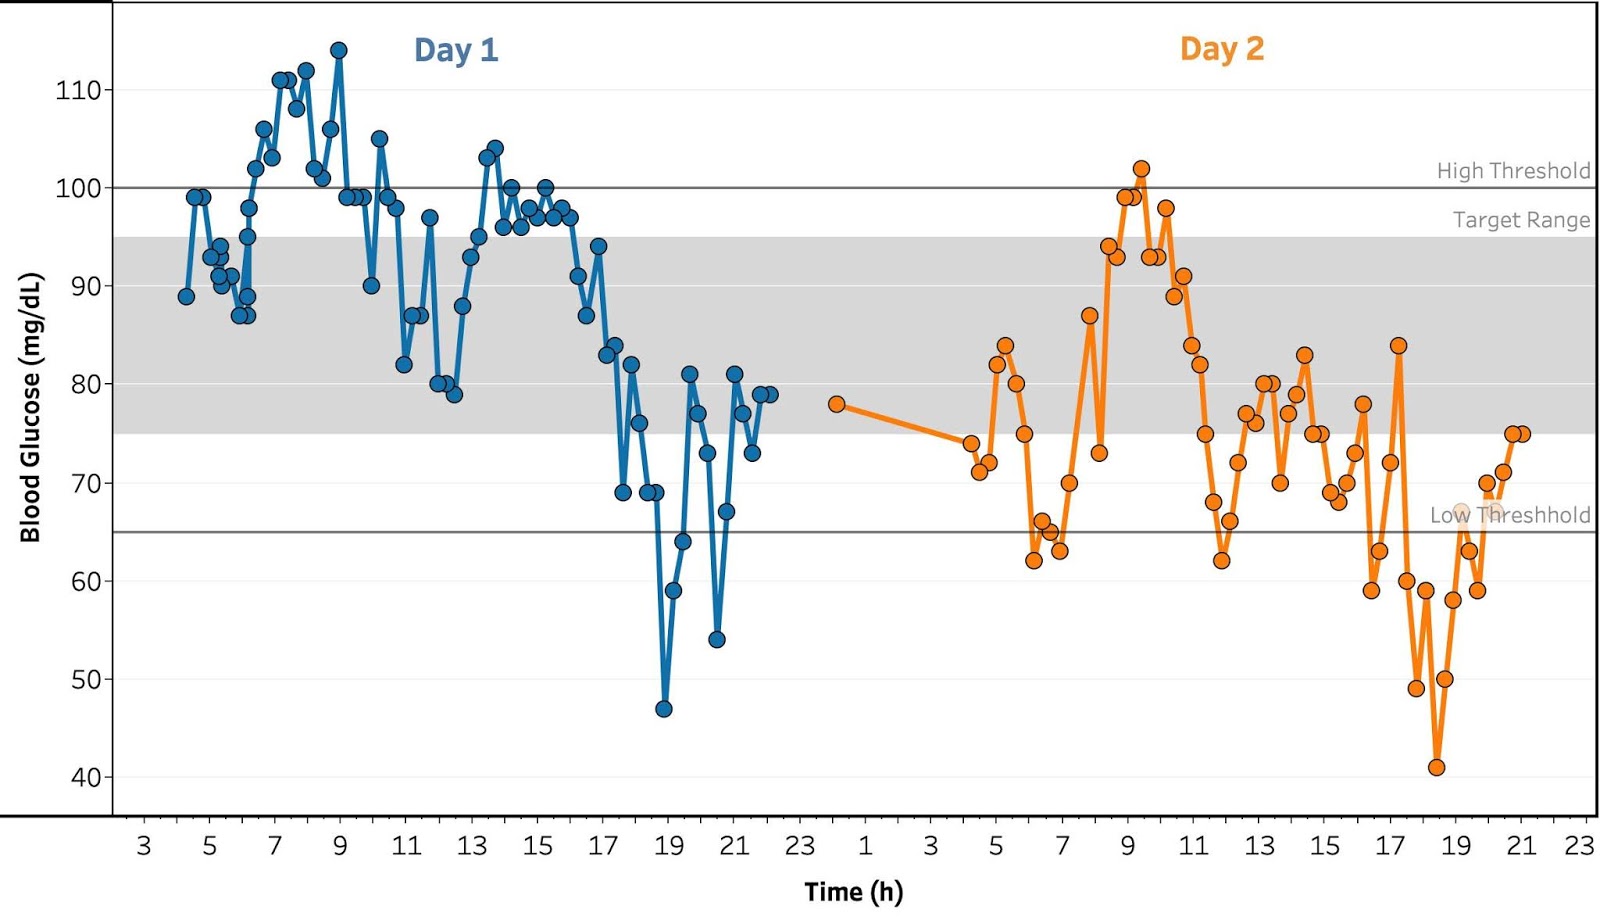
Figure 1. Measured blood glucose concentration vs. time for both days. Reference bands and lines show target range and high/low thresholds.
Table 1. Summary statistics of blood glucose concentration over 48 h. 

I don’t have enough data yet to analyze my food & exercise experiments (see next experiments), so for this week I decided to look at how my blood sugar varies over the course of a day.

Normally, I only check my blood sugar at key times (waking, going to bed, before injecting insulin, before eating, and 1 & 2h after eating). To see if there was anything to be learned from what’s happening the rest of the time, I decided to spend 2 days checking my blood sugar every 15 minutes.

Since I have Type 2 diabetes, my insurance won’t cover a continuous glucose monitor (CGM). Plus, blood glucose meters (BGM) are more accurate, even according to CGM manufacturers. So, for this experiment, I used my Freestyle Freedom Lite and just measured by blood glucose every 15 minutes.

This ended up being way more useful than I expected. There was a lot more going on between the times I usually measure than I realized. Here’s a most important things I learned, my new questions, and ideas for next experiments.


Key Learnings:

  • Shorter testing intervals around key times is extremely informative. My normal routine of testing blood sugar before and 1 & 2h post-meals is not sufficient. There’s a lot going happening on both shorter and longer time-scales that will be useful for understanding the effects of different interventions and for optimizing medication. 
  • I’m spending far more hypoglycemic than I had realized, most notably when I exercise. 
  • My peaks in blood sugar from breakfast and lunch occur >3h post-meal and persist until my next insulin dose. This is way longer than I expected and indicates that I need to switch to a longer acting insulin or change something about the meals.
  • My blood sugar drops significantly during cardio exercise (MMA, biking), then returns to normal over 30-45 min. I need to find a way to mitigate this to prevent my blood sugar from going dangerously low.


Questions:

  • What is happening to my blood sugar between waking and breakfast? Any risk of hypoglycemia while driving to work?
  • Is the long-duration peak in blood sugar after breakfast and lunch real & consistent? If so, what causes it and can it either be shortened by modifying the meal or mitigated using a longer-acting insulin?
  • What is the effect of different types of exercise? How can I mitigate or offset the initial drop in blood sugar during cardio without causing high blood sugar after the recovery?
  • What is the effect of dinner, disentangled from exercise?


Next Experiments

I’m always interested in ideas for new experiments, so please leave a comment if there’s something you’d like me to try.

  • Exercise studies: Measure blood glucose at 15 min. intervals for different duration and intensity bike rides and weight lifting. Also try varying time since last insulin dose and food eaten before exercising.
  • Long peak from breakfast & lunch: Measure blood glucose at 15 min. intervals a few more times after breakfast & lunch. Try varying protein and fiber content to see if those are the causes. Try normal-acting insulin to mitigate.
  • Food & medication studies: It’s proving difficult to disentangle the numerous effects going on at any given meal by adding or subtracting particular foods (data too noisy, too many measurements required to observe a statistically significant effect). Instead:
    • Skip meals and medication to measure background trends.
    • Consume individual ingredients (glucose, protein, fiber, etc.) or take individual medications to measure their direct effects.
    • Measure combinations of ingredients and medications to measure interaction effects.
    • This will require more experiments, but I think in the end it will require less time & effort to get reliable results.

Details

Purpose

To better understand trends in my blood glucose over the course of a day and determine if there are trends or events that I should investigate further.


Design/Methods

General. Blood glucose was measured approximately every 15 min. using a FreeStyle Freedom Lite glucose meter and FreeStyle lancets & test strips. No special precautions were taken to clean the lancing site before measurement. To take a sample, the lancing devices was used to pierce the skin at an ~45 deg. angle from the finger. Blood was then squeezed out by running the thumb and pointer finger of the opposite hand from the first knuckle to the lancing site of the finger. Blood was then wicked into a test strip that had been inserted into the meter and the glucose reading was recorded.

Medication and meals were kept as normal, with the exception of an additional 2 g of glucose eaten with breakfast on the first day as part of an experiment on the effect of glucose on my blood sugar.


Data

Link


Results & Discussion

Overall. The full set of data is shown in Figure 1 with summary statistics in Table 1. Major insights:

  • I had far more hypoglycemic events than I expected, 13% overall and 21% in day 2, with a low of 41 mg/dL. This was extremely disturbing, as hypoglycemia can be extremely dangerous. A closer look at the data (see Evening section), shows this to be from riding a stationary bike, which I hadn’t noticed before because my sugar returns to normal levels after 30-45 min. 
  • Other than the low episodes in the evening, and factoring out time spent high due to eating extra glucose as an experiment, my control was pretty good. 
  • Clear dips and spikes were visible from eating, exercise, and insulin, many of which occurred at shorter time scales than I normally test.

To really see what’s going on, though, let’s zoom in different times of the day.

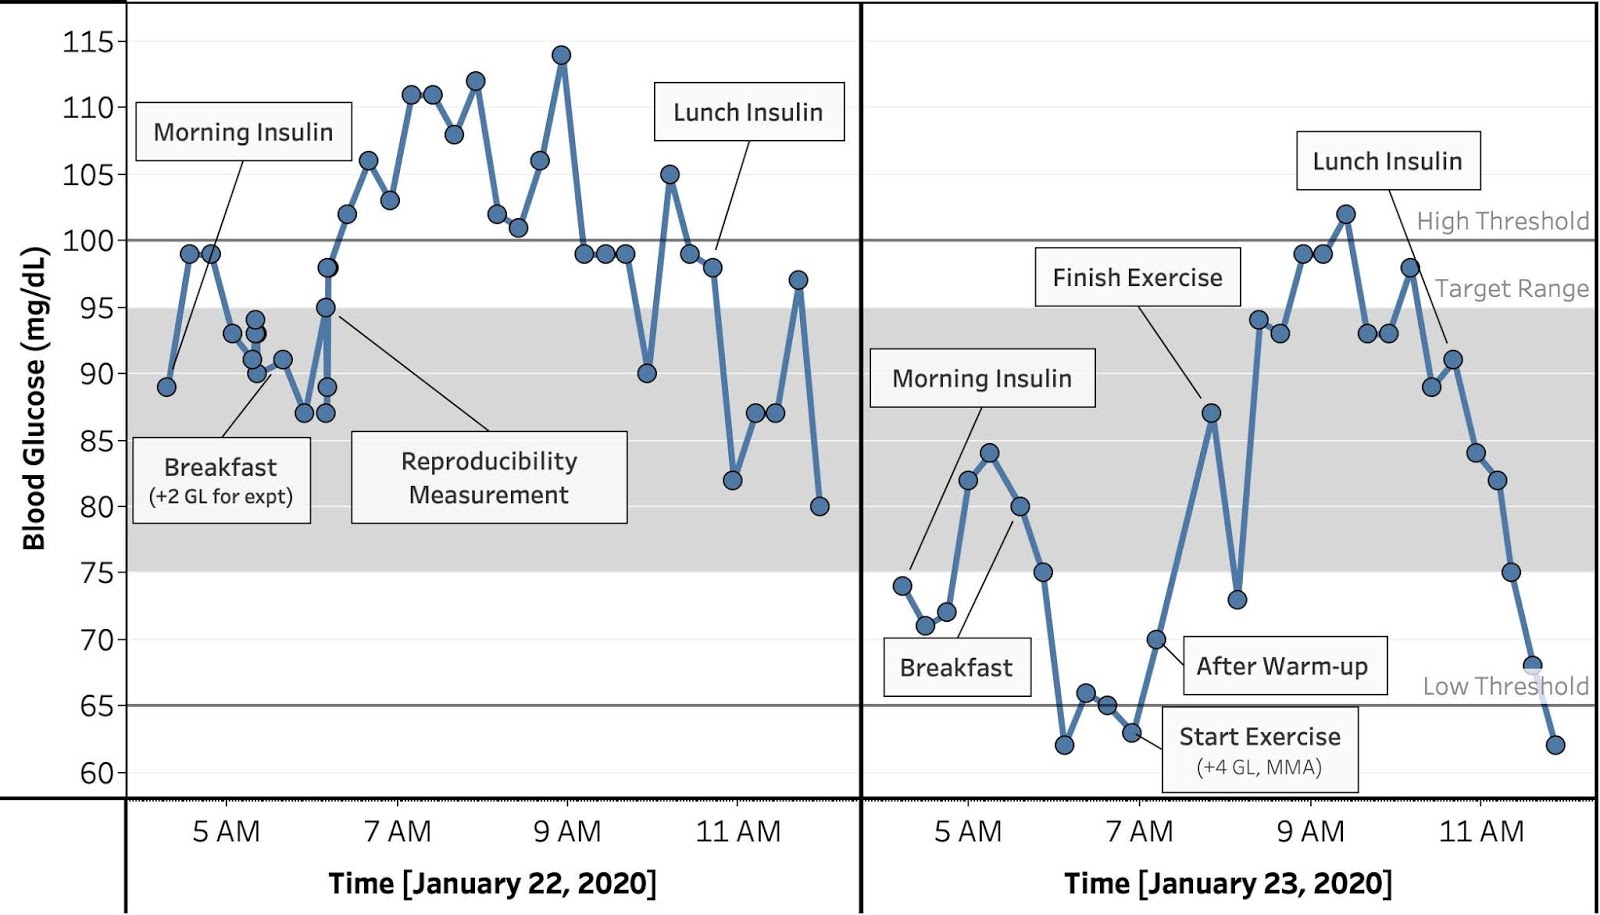
Morning:

Figure 2. Measured blood glucose concentration vs. time from 4a-12p, with annotations for key events. Reference bands and lines show target range and high/low thresholds.
  • Waking to breakfast: 
    • The first morning, there was a 10 mg/dL rise, followed by an identical drop over the next 45 min. My normal routine of measuring up arising and before dosing for meals would completely miss this. 
    • The second morning, the rise was the same magnitude (10 mg/dL), but slower, so there was time for it to fall back down before my breakfast insulin. Either way, looks like there’s some timing variability here. Need to investigate further.
  • Breakfast:
    • The first morning, I ate an extra 2 g glucose as part of my food & exercise experiments (see next experiments) and saw an immediate rise in sugar, reaching peak after about 1.5h. Very interestingly, the peak persisted for >5h, much longer than I usually test for. 
    • The second morning, I saw an 18 mg/dL drop in the first 45 min. after taking insulin, which then stayed steady for the next hour. This is larger than expected given the only difference from Day 1 was not eating the 2 g glucose, but may be within natural variation. 
    • More significant was the effect of a one hour mixed-martial arts (MMA) class. Since my blood sugar was low, I took 4 g glucose (expected to raise my blood sugar by ~20 mg/dL). From the start to end of exercise, I saw an ~25 mg/dL rise. While this could be accounted for by the 4 g glucose, based on Day 1, I would also expect an ~20 mg/dL rise from breakfast. All together, this suggests a possible 20 mg/dL drop from the MMA class (very speculative, needs more study). On top of that, I saw a brief 15 mg/dL drop after the MMA class finished, which then came right back up. Not sure what this means, but it’s consistent with other exercise effects (see evening section)
    • Lastly, the breakfast on Day 2 showed the same long duration peak as day 1, with blood glucose peaking 3.6h after breakfast and persisting for 5 h, until I took my insulin for lunch. I use a rapid acting insulin at breakfast. However, since I made the switch to the rapid-acting insulin, I added additional protein and fiber to the meal. Need to investigate whether I should switch to normal-acting insulin.    

Afternoon:

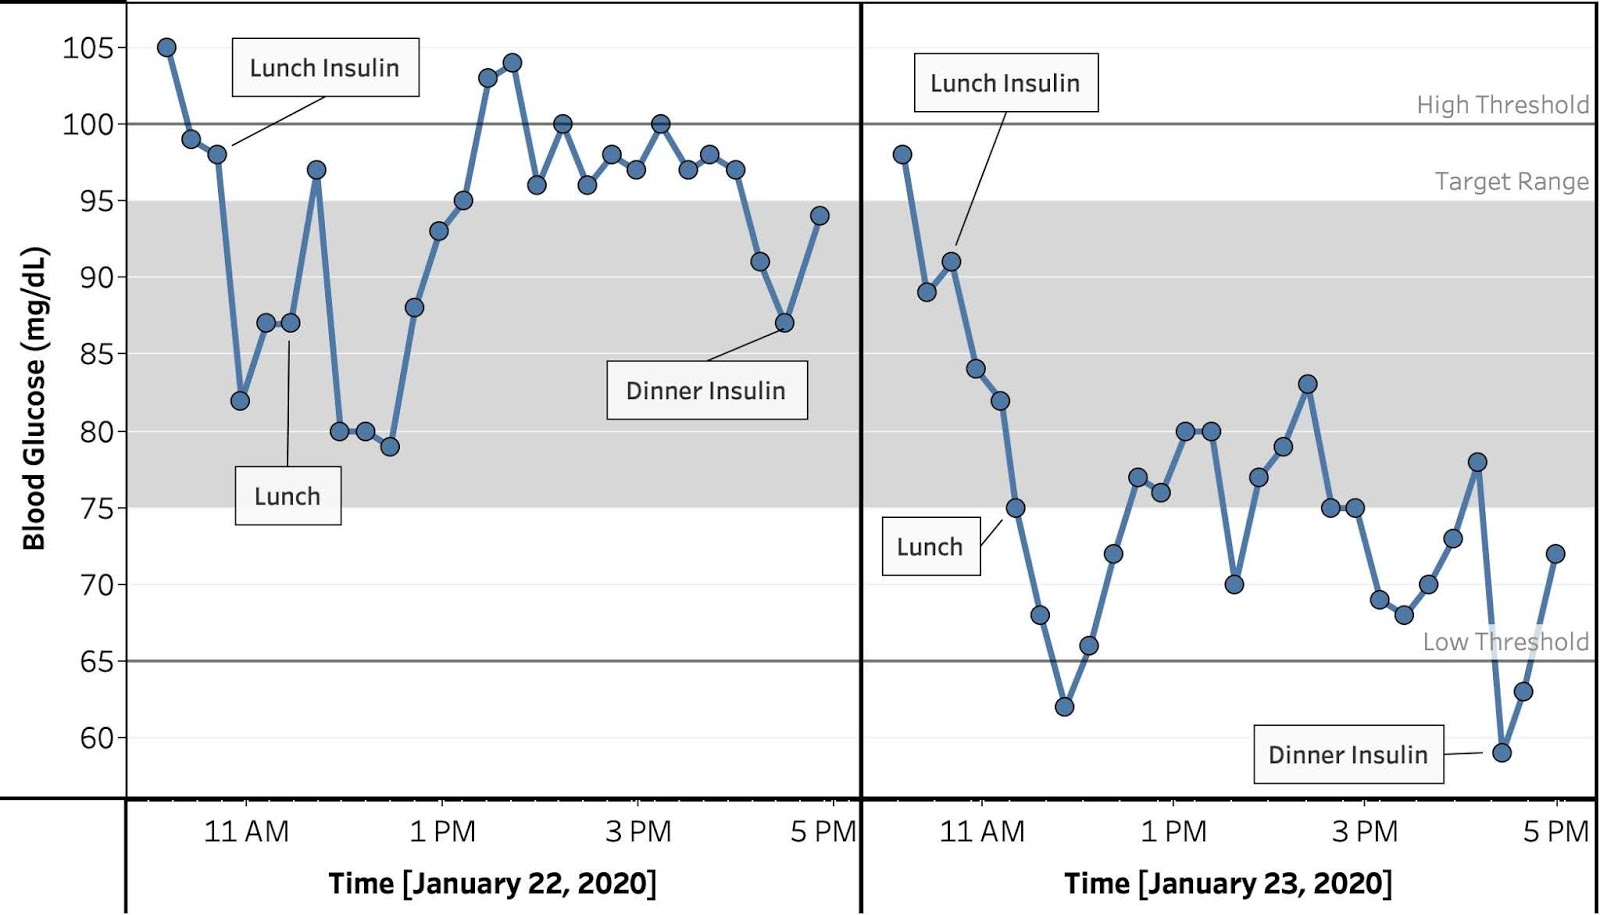
Figure 3. Measured blood glucose concentration vs. time from 10a-5p, with annotations for key events. Reference bands and lines show target range and high/low thresholds.
  • The afternoon was a lot less eventful. On both days, I saw a 10-15 mg/dL drop in the 40 min. between taking insulin and eating lunch, followed by a continued drop over the next 30 min., then a, ~15 mg/dL rise. On Day 1, the rise almost exactly offset the drop, while on Day 2, the drop was ~10-15 mg/dL larger and therefore wasn’t full offset. This may be due to the morning exercise on Day 2, or some other source of variation. Need to keep an eye on this.
  • Either way, lunch medication plus food seems pretty well calibrated, which is a bit odd since my breakfast and lunch are identical. Hypotheses to test:
    • There’s some other factor causing a drop in the afternoon, offsetting the long peak seen in the morning
    • The long peak at breakfast is related to the dawn phenomenon (additional glucose from liver and/or reduced insulin sensitivity)
    • To test these, could try skipping meals and their associated insulin, which should have different effects depending on the cause of the discrepancy.

Evening:

Figure 4. Measured blood glucose concentration vs. time from 4-11p, with annotations for key events. Reference bands and lines show target range and high/low thresholds.
  • The fact that I both eat dinner and exercise in the evening makes analysis difficult. Need to run experiments where I do one or the other to better disentangle the effects.
  • Dinner:
    • On both days, my blood glucose increase slightly after taking my dinner insulin. This suggests my blood sugar may still have been rising from after lunch, however, this is a very long time for food to be having an effect. Since my breakfast and lunch are high in protein and fiber, I tried to find information on their direct and indirect effects on blood sugar. However, the information I found was both spotty and ambiguous (especially for fiber, for which I found a lot of articles on using it for diabetes prevention, but no well controlled studies of its immediate effect on blood sugar). Need to test this directly.
    • After the immediate drop, exercise prevents any meaningful analysis of the effect of dinner except to say it doesn’t appear to significantly raise my blood sugar. 
  • Exercise:
    • I did ~30 min. of weightlifting on Day 1. During that time, I saw a ~12 mg/dL spike, which came back down immediately after. My blood sugar typically increases at the start of exerciseand this is consistent and small enough not to worry about.
    • The effect of biking was more significant. I typically to 2×15 min. stints on a stationary bike in the evenings and previously hadn’t noticed any major effects on my blood sugar at my normal 1h and 2h post-meal checks. By testing every 15 min., I can see that, even with taking glucose before starting, these bike rides are dropping my blood sugar by 10-20 mg/dL over the course of the ride, after which it comes back up to baseline over 30-45 min. 
    • On both days, even with taking glucose before hand, the bike rides sent me into dangerously hypoglycemic territory. Notably, I didn’t notice any symptoms of hypoglycemia, possibly because they were overshadowed by the effect of the exercise itself.
    • This drop during biking is very worrisome and something I completely missed with my normal testing routine. A few takeaways:
      • I need to run more experiments to figure out the exact details and how to mitigate this effect.  Bike further away in time from peak insulin
      • Use a faster acting and/or better timed glucose to offset drop
      • Since blood sugar can drop then rise quickly with physical activity, I can’t rely on just testing before and after meals. For any physically significant activity, I need to test before and after until I’m sure I understand it’s effect.

Overnight. I saw a 5 mg/dL drop overnight between Day 1 and Day 2. That’s within the normal variance of my meter, so I’ll check over a larger number of days to see if it’s real. Either way, not significant relative to the other effects I observed.


Conclusions & Next Experiments

See summary section above


– QD


Get new posts by email or rss feed

Experiment #1: Measurement Reproducibility

If I’m going to study how external stimuli affect blood glucose, the main measurement device I’ll be using will be a glucose meter (the one I have is the FreeStyle Freedom Lite). In order to understand the measurements I make, I’m going to need to know the accuracy and the precision of the device. By law, home blood glucose meters must give results that are within 20% of laboratory tests 95% of the time. That would mean that if someone’s blood glucose was 100 mg/dL, the meter could report 80-120 mg/dL. If that’s the kind of precision I’ll be getting, then I should just give up now. Fortunately, they’re a lot better than that. 

Although there are a ton of studies on the accuracy and precision of blood glucose meters, I wanted to assess my specific meter under the conditions that I will be using it. To assess the accuracy, I measured the FreeStyle Control solution. To assess the precision, I measured my own blood glucose in sets of 5 measurements at different times over the course of the week (so that I’d have different glucose numbers).


Purpose

To evaluate the reproducibility of the FreeStyle Freedom Lite glucose meter under the conditions that will be used for subsequent experiments.


Design/Methods

General. All measurements were done using a FreeStyle Freedom Lite glucose meter and FreeStyle lancets & test strips. To reflect my normal usage, no special precautions were taken to clean the lancing site before measurement. To take a sample, the lancing devices was used to pierce the skin at an ~45 deg. angle from the finger. Blood was then squeezed out by running the thumb and pointer finger of the opposite hand from the first knuckle to the lancing site of the finger. Blood was then wicked into a test strip that had been inserted into the meter and the glucose reading was recorded.

Control solution test. FreeStyle control solution was purchased from Abbot on Amazon. Drops of solution were removed from the bottle according to the manufacturers instructions and tested using the procedure described above.

Blood tests. Sets of 5 blood samples were measured according to the procedure described above. The sample set was taken from either 5 locations on the same finger or the same location on 5 separate fingers over the course of ~1 min. Times were chosen to obtain a range of blood glucose values. 


Data


Results & Discussion

Control Solution Tests. Unfortunately, commercial control solutions do not specify the exact glucose concentration, but instead only give a range of acceptable values that fall within the FDA’s +/-20% accuracy requirement (link, link). The Freestyle control solution kit I purchased came with two solutions, “High” and “Low”. My vial of test strips specifies the acceptable ranges of these solutions as 248-372 and 30-60 mg/dL, respectively. Assuming the ranges are centered on the actual value, that gives actual values of 310 mg/dL for “High” and 45 mg/dL for “Low.” I took 8 measurements of each control solution. 

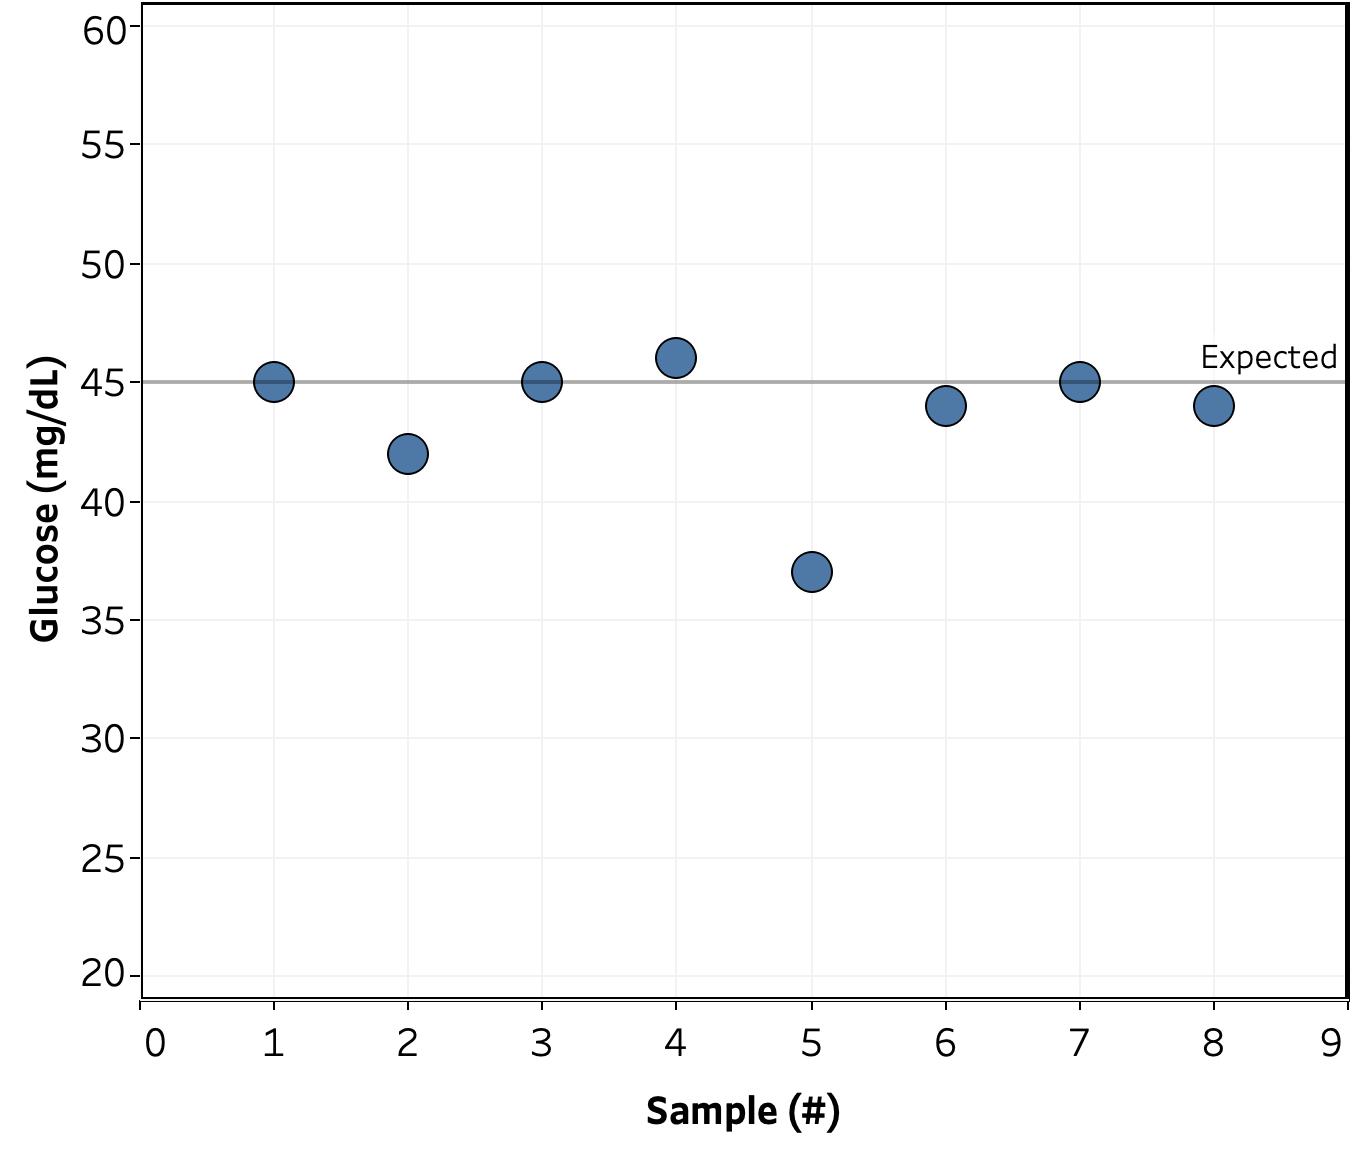
Figure 1. Measured glucose concentration vs. sample # for “Low” control solution. The reference line indicates the expected reading based on the average of the manufacturer’s acceptable range.
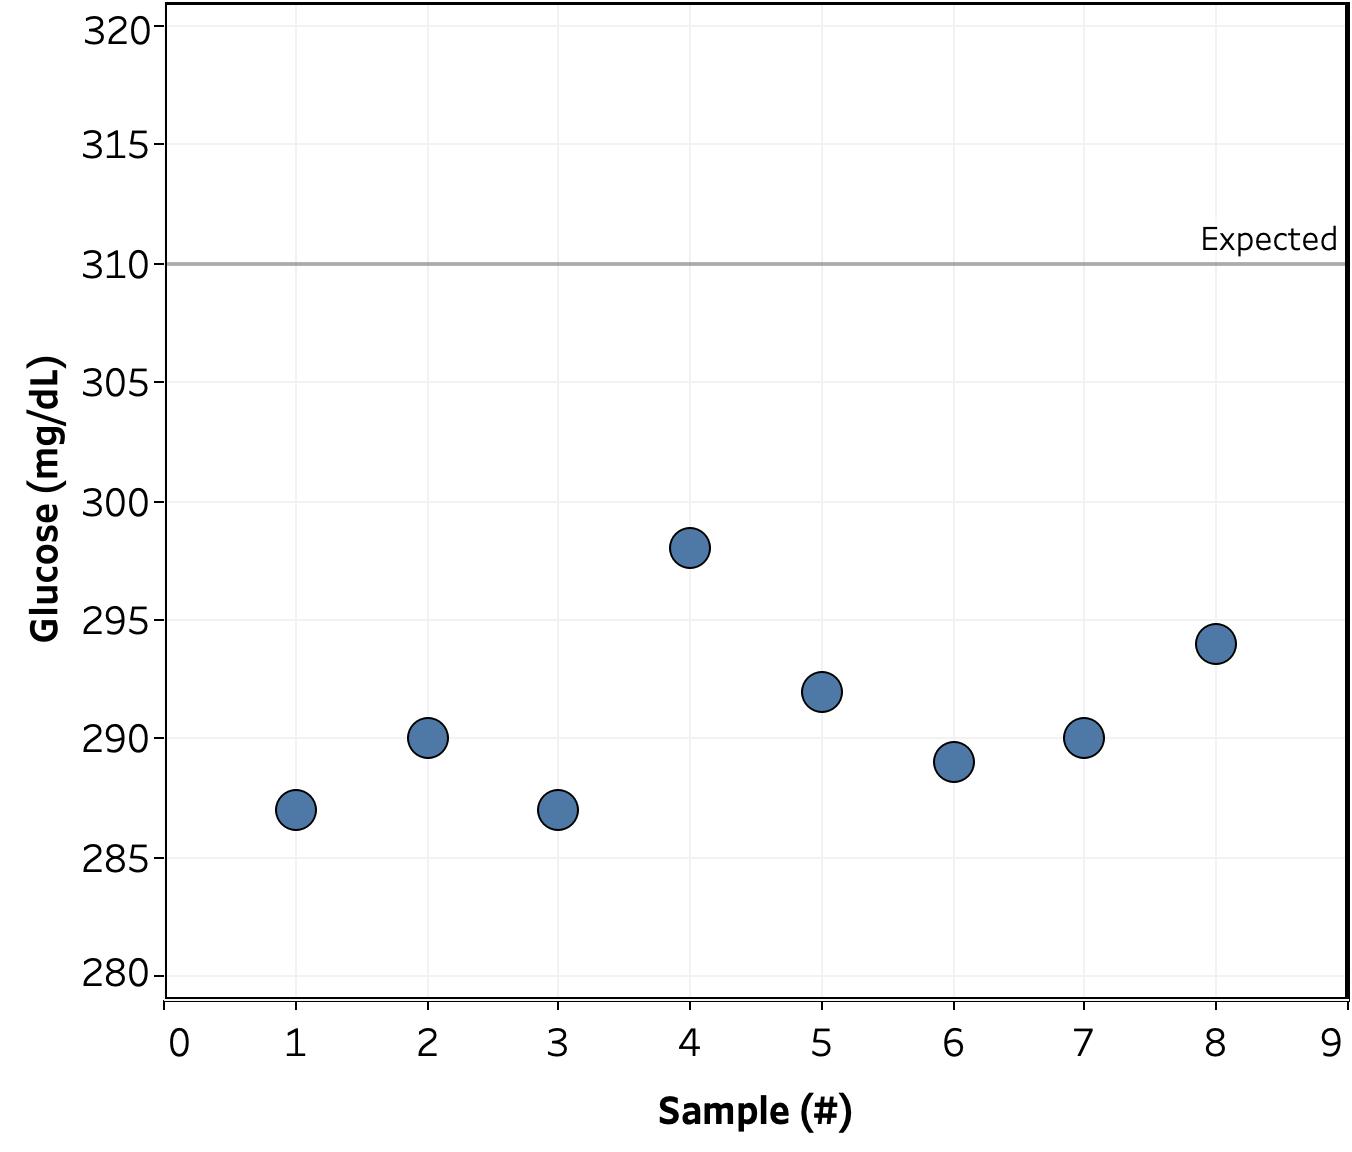
Figure 2. Measured glucose concentration vs. sample # for “High” control solution. The reference line indicates the expected reading based on the average of the manufacturer’s acceptable range.
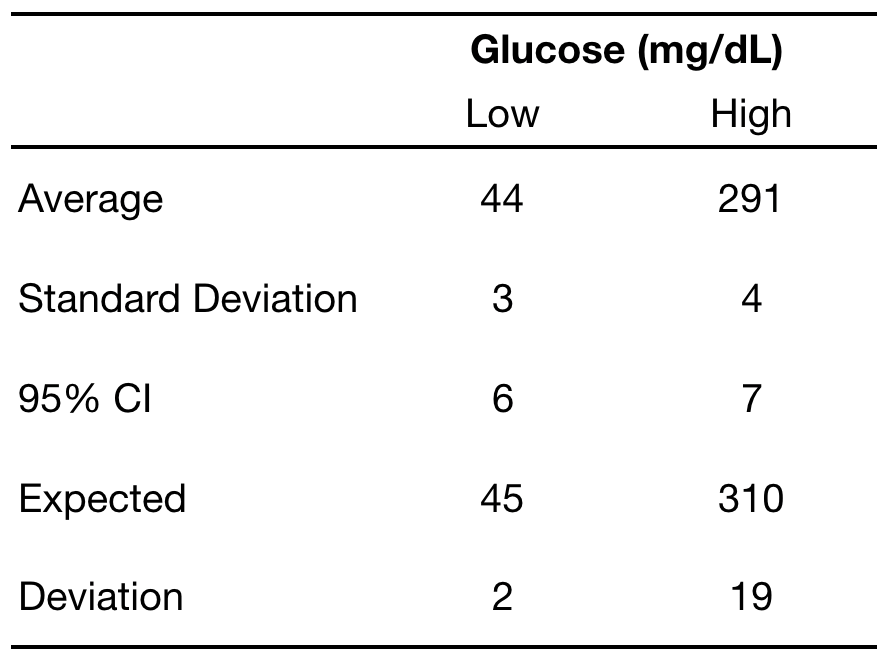
Table 1. Table of results of glucose measurements of control solution.

Happily, the readings were reasonably close to the expected value: 2 mg/dL (3%) for the “low” solution and 19 mg/dL (6%) for the “high”. The standard deviation and 95% confidence interval were more consistent between the two solutions at 3-4 & 6-7 mg/dL, respectively. As such, if a measurement were run repeatedly, I can expect it to fall between +/- 7 of the observed value 19 out of 20 times. 

Blood tests. Next up was testing the accuracy of actual blood measurements. Shown below are the results of 11 sets of 5 measurements each taken over 7 days at different times of the day. 

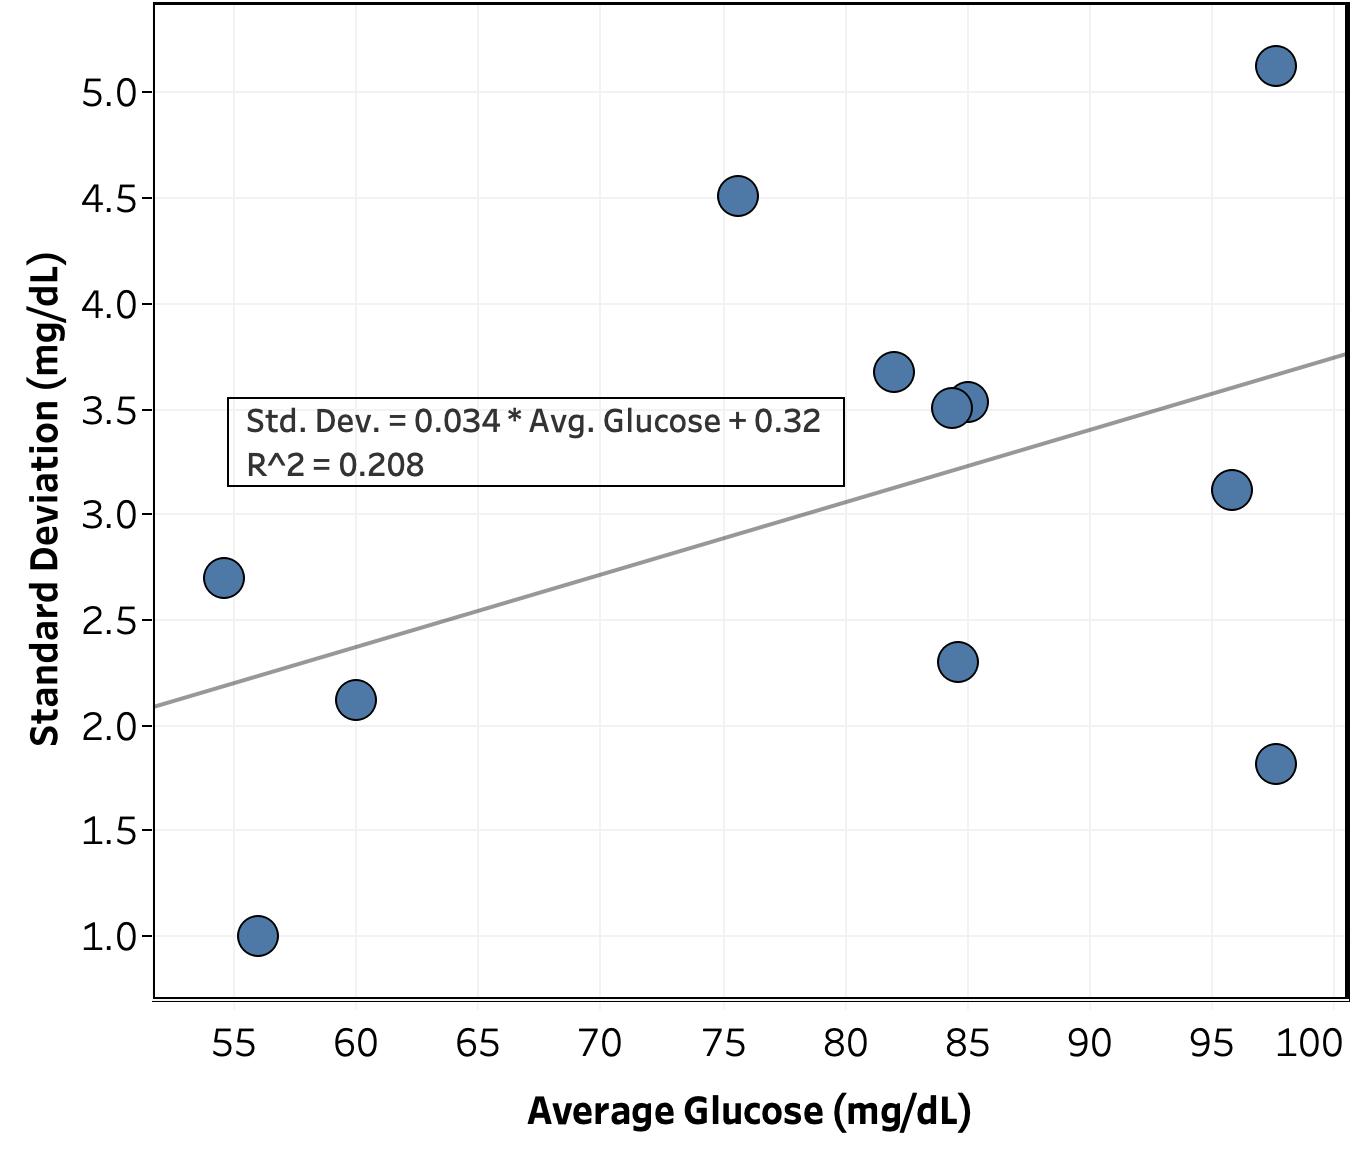
Figure 2. Standard deviation vs. average glucose for blood measurements. The grey line and R^2 value are for a linear fit to the data.
Table 2. Table of results of blood glucose reproducibility measurements. 

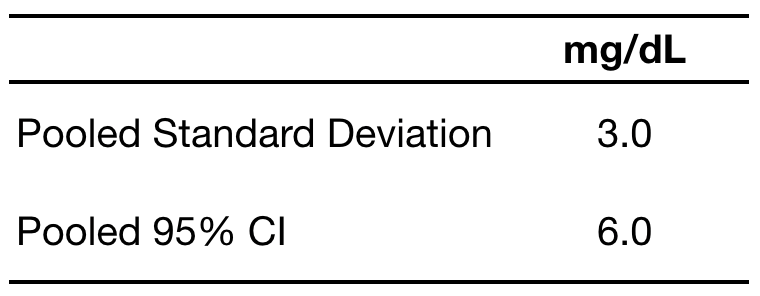
Surprisingly, the precision of the blood glucose measurements was just as good as those of the control solutions. Looking at Figure 2, there’s only a weak correlation between standard deviation and average glucose for a set of measurements (R^2 = 0.21). Given that, I was able to calculate a standard deviation for the whole data set (i.e. pooled standard deviation) of 3.0 mg/dL (95% CI = 6.0 mg/dL), nearly identical to that of the control measurements. This suggests that the variation in the measurements is coming from something in the meter, test strips, or external environment, rather than something in the blood. 


Conclusions

A standard deviation of only 3 mg/dL blood glucose measurements should be good enough to measure the effect of different foods and other external stimuli or interventions. While there is a small correlation between the standard deviation and average glucose, it’s weak enough that 1) it may not be real and 2) I can ignore it for now.


Next Experiments

I’m always interested in ideas for new experiments, so please leave a comment if there’s something you’d like me to try.

  • I will continue to measure the precision of the meter on a less frequent basis (sets of 5 measurements). Purpose is to:
    • Get a better a more accurate measure of the correlation between standard deviation and average glucose
    • See if there’s any trend in standard deviation with time, time of day, same vs. different fingers, etc.
  • To ensure I’m not biasing the sample set by only taking measurements when I’m interested in the reading, I will randomize when I do a reproducibility measurement by rolling two ten-sided dieand taking a set of 5 measurements when the number is ≤ 2 (~2/week).
  • For next week, I’ll start measuring how my blood glucose is affected by food and exercise.
    • Getting a clean measurement for these is going to be tricky, as at any given time, there are a large number of factors affecting my blood glucose.
    • To deal with this, I will pick standard times of day where external factors are as consistent as possible and then flip a coin to randomly decide whether to eat or exercise a fixed amount and then measure my blood sugar over time.
    • It may take a while to get enough data to get reasonable statistics. If I don’t have enough data by next week, I’ll  post an exploratory analysis of the initial data.


– QD

P.S. I’m sorry for the less than ideal graph/table arrangement on this post. I’m still getting a hang of blogger and I can’t figure out how to get two pictures to display next to one another.


Get new posts by email or rss feed